Block builder
Build a simple indicator from rows of controls — inputs and lines — and see the script it writes.
The Blocks tab of the indicator editor builds an indicator from rows of controls instead of typed code. Each row is one line of the script, and reads left to right the way that line is written, so switching to Source shows exactly what the rows say. The two tabs are one script: a change in either is a change in both.
The builder covers a small part of the language — numbers as inputs, and one moving average or window per line. Anything more, including the marks an alert can follow, is written in the source editor.
The two kinds of row
The buttons under the rows add one of each, filled in with the values below. A new row is named len or line, or
len2, line2 and so on when that name is already taken, so two rows never start with one name.
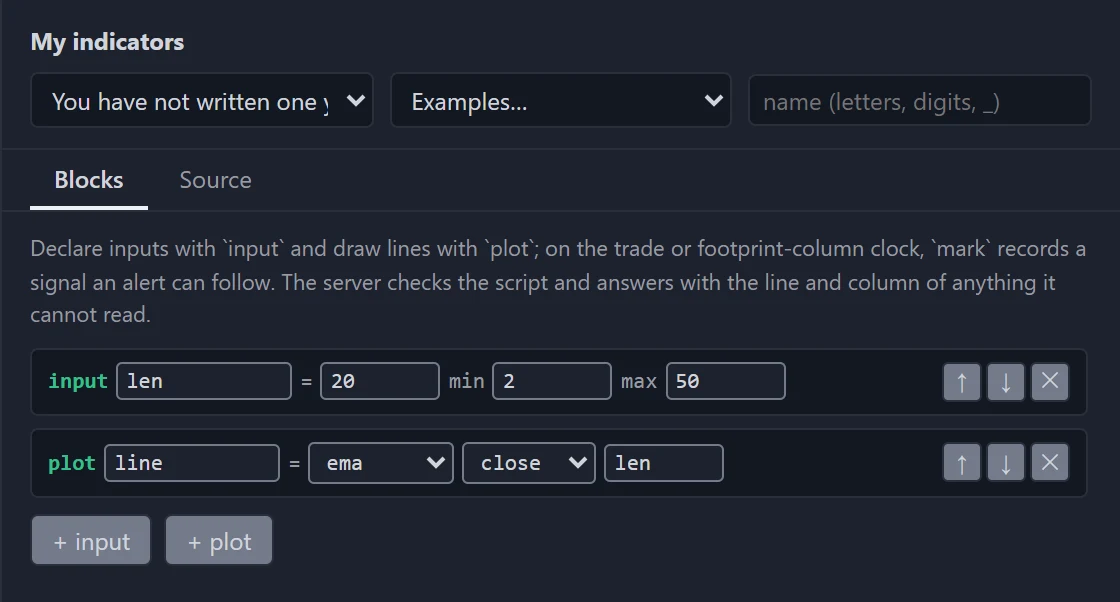
Input
input len = 20, min 2, max 200A number the indicator's settings let you change: a name, its default, and the minimum and maximum it may take. On a chart it becomes a control on the indicator's Parameters tab, within those bounds and the ones TapeHawk sets.
Plot
plot line = ema(close, 20)A line the indicator draws: a name, then either a series on its own — pick (none) in the function list — or a function over a series with a length. The length is a number, or the name of an input above the row: type it, or pick one of the inputs above the row that the box suggests.
The builder has no row for an alert condition. A script announces what an alert follows with mark, which a candle
script cannot use — see Custom indicators.
Series and functions
| Series | What it is |
|---|---|
close, open, high, low | The candle's prices |
volume | The candle's volume |
delta | Buying minus selling volume in the candle — the order flow |
cvd | The running total of delta, restarting at 00:00 UTC on candles and footprint panels |
| Function | Over the last length values, the… |
|---|---|
sma | simple average |
ema | exponential moving average, which weighs recent values more |
rma | Wilder's moving average, the smoothing RSI and ATR use |
wma | weighted average, where each value counts in proportion to how recent it is |
stdev | standard deviation — how far the values spread around their average |
highest | highest value |
lowest | lowest value |
sum | total |
The full meaning of each series and function, including what they give before there are enough candles, is in the Language reference.
Order matters
A row can use only the inputs above it, and the length box suggests only those. The script is read from top to bottom, so a plot above the input it uses does not compile.
- Drag a row to move it, or use ↑ and ↓ at its right end.
- ✕ removes a row.
The builder does not check bounds or lengths itself. The editor checks the script it writes as you go, and anything wrong appears in the list under the rows, as for a typed script — see Source editor.
A row being edited stays on screen even while the line it writes is wrong — a name cleared to be retyped, a length naming an input that is not above the row yet, or a row moved above an input it uses. The rows stay as they are, and the list under them says what to fix.
When a script cannot be shown as blocks
A script that uses anything else — arithmetic, a name for an intermediate value, a nested function, another function, a switch or a list as an input, a colour, a comment, a blank line between rows, or even extra spaces — cannot be shown as rows. The tab then shows no rows, only a note that the script uses something the block builder does not cover — naming the first line it could not read — and that nothing is lost by editing it in the Source tab.
Nothing is changed or lost: the script still checks, saves and draws. A saved indicator opens on Blocks when it can be shown there and on Source otherwise; the starter examples always open on Source.
Custom indicators overview
Write your own indicator as a short script — who can, where the editor is, saving and deleting, and how your indicator is drawn and set on a panel.
Source editor
Write an indicator as text — the live check and preview, reading the error list, warm-up, and what closing the editor does.