Source editor
Write an indicator as text — the live check and preview, reading the error list, warm-up, and what closing the editor does.
The Source tab of the indicator editor is the script as text, with line numbers beside it. Everything the language can say is written here — see the Language reference. A script that only uses inputs, single moving averages and comparisons can also be edited as rows, in the block builder.
A new editor starts with this script:
input len = 20, min 2, max 50
plot line = ema(close, len)
The box is plain text: there is no colouring and no completion. While you type in it, the chart's keyboard shortcuts are off, so Backspace edits the script instead of deleting a drawing.
The live check and preview
A moment after you stop typing, the editor sends the script to TapeHawk's server, which checks and compiles it. The result is drawn on the active panel behind the dialog, on that panel's real data, at the script's default settings.
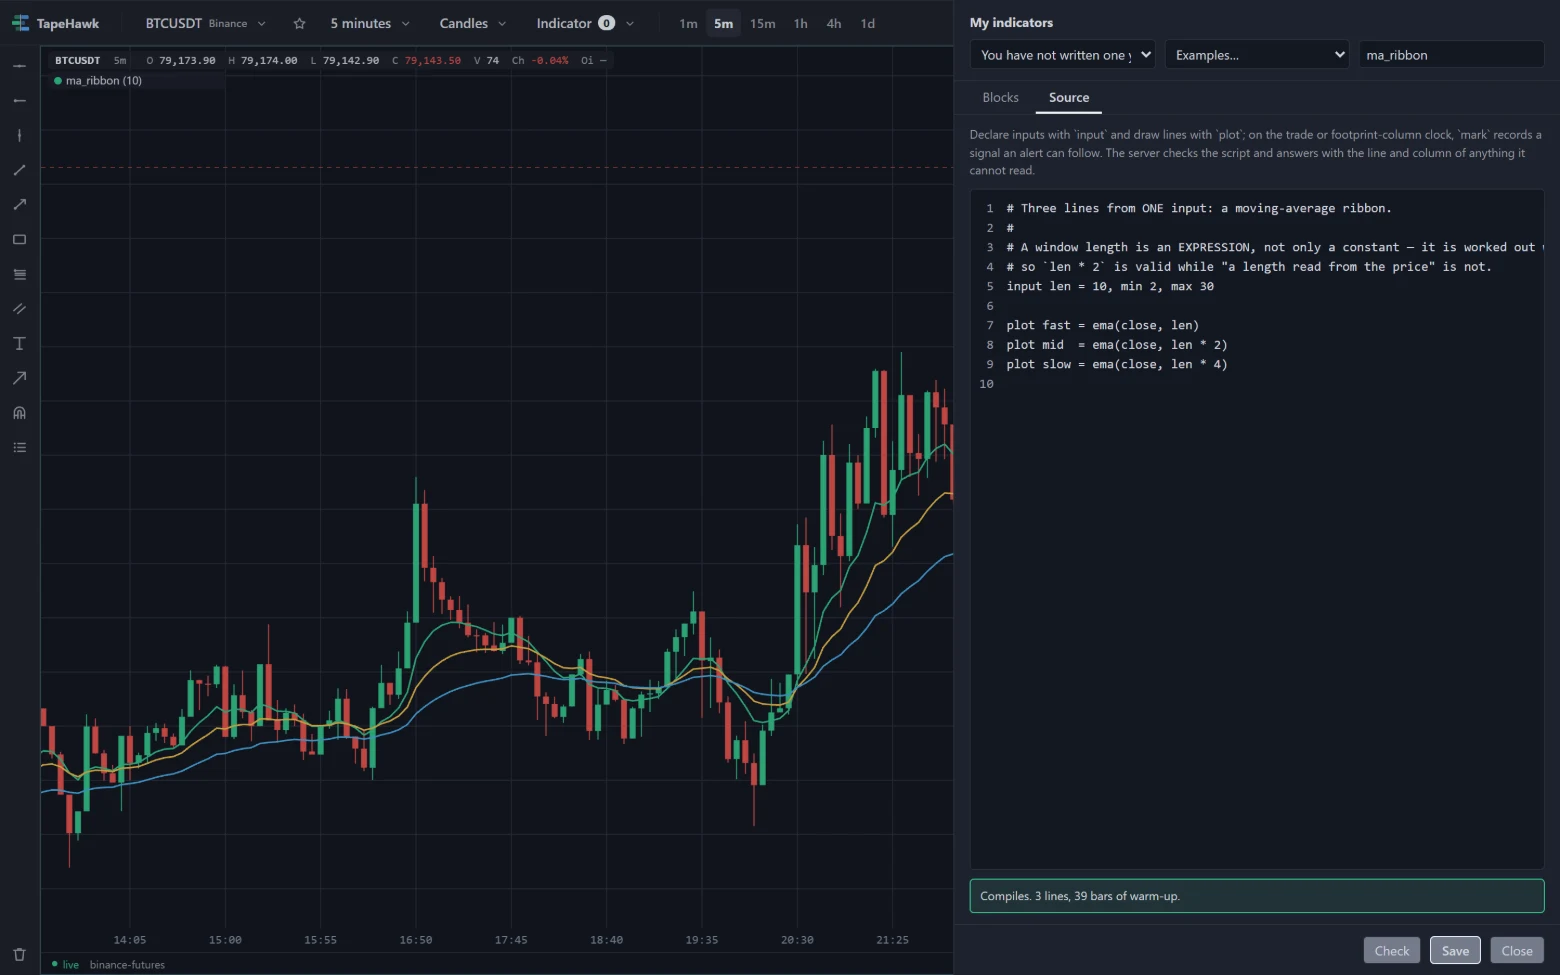
- When the script compiles, a line under the box says so — how many lines it draws and how many bars of warm-up it
needs at its default settings, for example
Compiles. 1 line, 19 bars of warm-up.— and the preview is redrawn. - When it does not, the list of errors replaces that line, and the preview keeps showing the last version that compiled. A script is broken for most of the time it is being typed; the chart does not flicker to nothing in between.
Check sends the script straight away instead of waiting for the pause. The button reads Checking… from the moment you type until the answer arrives.
The preview is drawn under the name in the name box — or a placeholder name while the box is empty — so a name the server does not accept shows up in the error list before you save.
When the editor has a saved indicator open, panels already drawing that indicator draw the draft instead, at its default settings, until the dialog closes.
If the indicator runtime cannot be loaded in your browser, a note under the box says so and nothing is drawn. The note stays while the dialog is open, because a script compiling does not bring the runtime back; closing and opening the editor tries again. The script is still checked, and saves as usual.
What the preview can draw
The preview is an ordinary indicator on the active panel, and the panel loads what the draft reads for it:
- A
@printscript draws on a heatmap panel, which starts recording trades for it, and begins from the trades that panel already holds. Its marks are drawn there in the shape and colours the script declares. - A
@bookscript draws on a heatmap panel from the moment it is previewed, because the order book is not recorded. - A
@cellscript draws on a candles or footprint panel, which loads footprint columns for it: its lines, and its marks on each column once it has closed. On a heatmap panel it runs on the heatmap's own columns instead. - A bar-clock script that reads
delta,cvdorvoldraws on a candles panel, which loads order flow for it. See Clocks.
Errors
Each row in the error list gives:
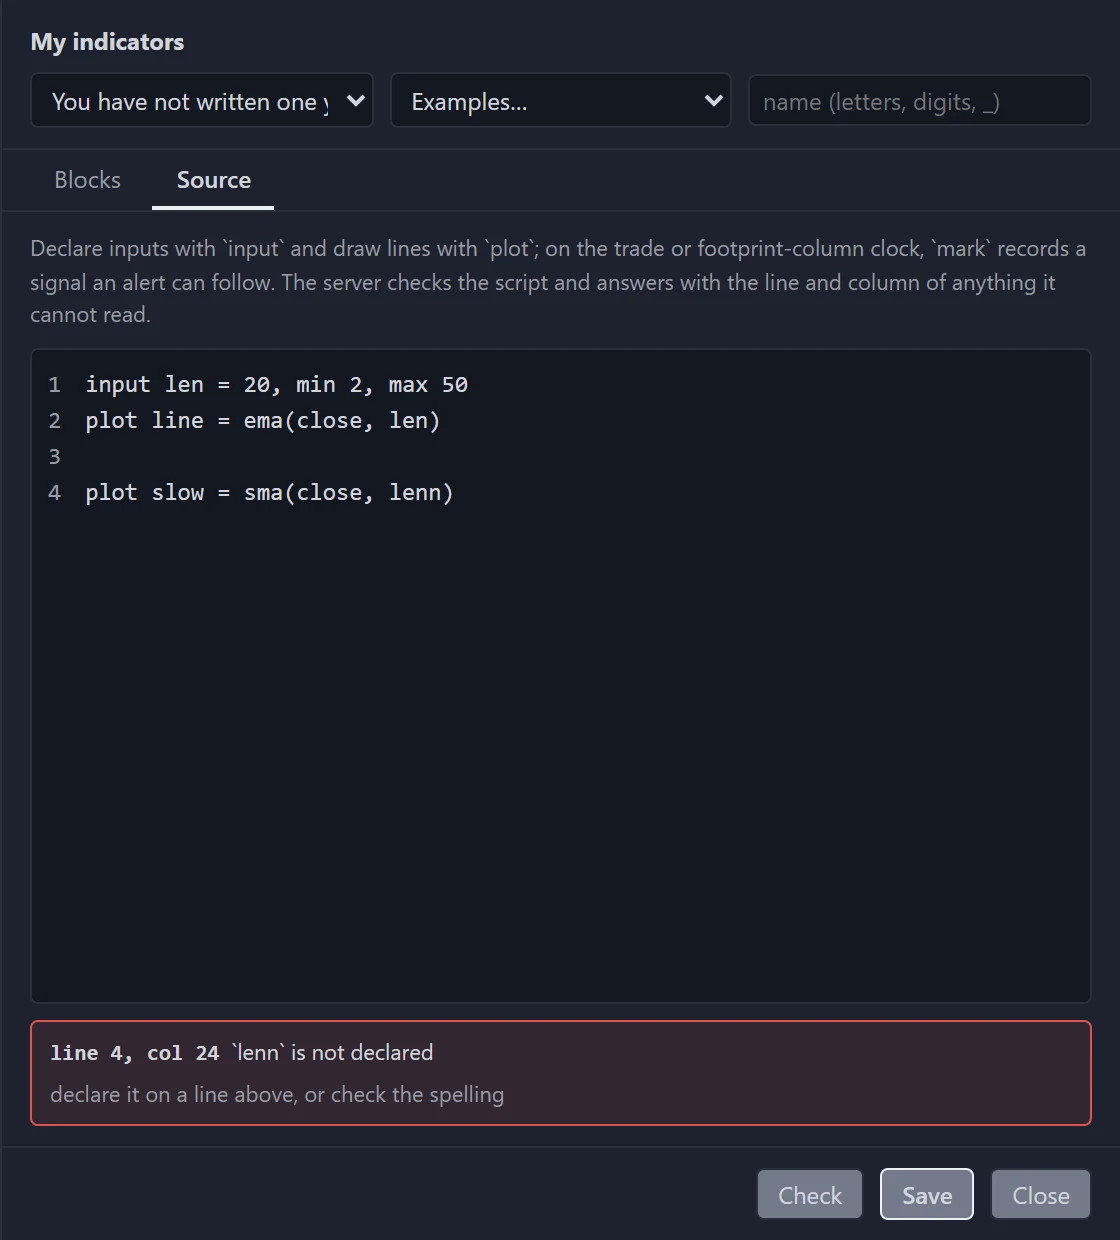
- where —
line 3, col 14— when the problem has a place in the script; - what the server could not accept;
- and, often, a hint at what to write instead.
The check stops at the first problem it finds, so the list usually holds one row, and fixing it can reveal the next.
Click a row on the Source tab to put the cursor at that line and column, accented letters and all. When you have typed since the script was checked, or the position lies past the end of the line or the script, the row adds The script has changed since this was reported, so the position is approximate. and the cursor goes to the nearest place there is.
The messages are the server's own words, and the code they quote between backticks is your own. Limits and troubleshooting lists the common ones and what to do about each.
When Save is refused, its reasons take the place of the list until you change the script, because they are about the save rather than about the last keystroke — a limit on your account, for example.
Warm-up
Most functions need a run of bars before they give a value: a 20-bar average has nothing to say about the first 19 bars.
On the chart, a line is blank over those bars — worked out from the setting in use, so ema(close, len) at len 20 starts
on the 20th bar.
The bars of warm-up in the result line is that figure for the preview's settings, every input at its default: the
starter reports 19 for ema(close, len) at len 20. Whether the script can be saved is decided by another figure, the
warm-up at the largest value each input may take — the starter's would be 49, because len may go up to 50: on the bar
clock a script may need at most 1,000 bars of warm-up at its inputs' largest values, and a save past that is refused with
the number. A generous max on an input used as a length is what pushes a script past that — keep each max
to what the indicator really needs.
Closing
Close, Esc or a click outside the dialog closes the editor and takes the preview off the chart. A script you have not saved is gone when the dialog closes; save it first, under any name, to keep it.