Introduction
What TapeHawk is, what it draws, and how these docs are laid out.
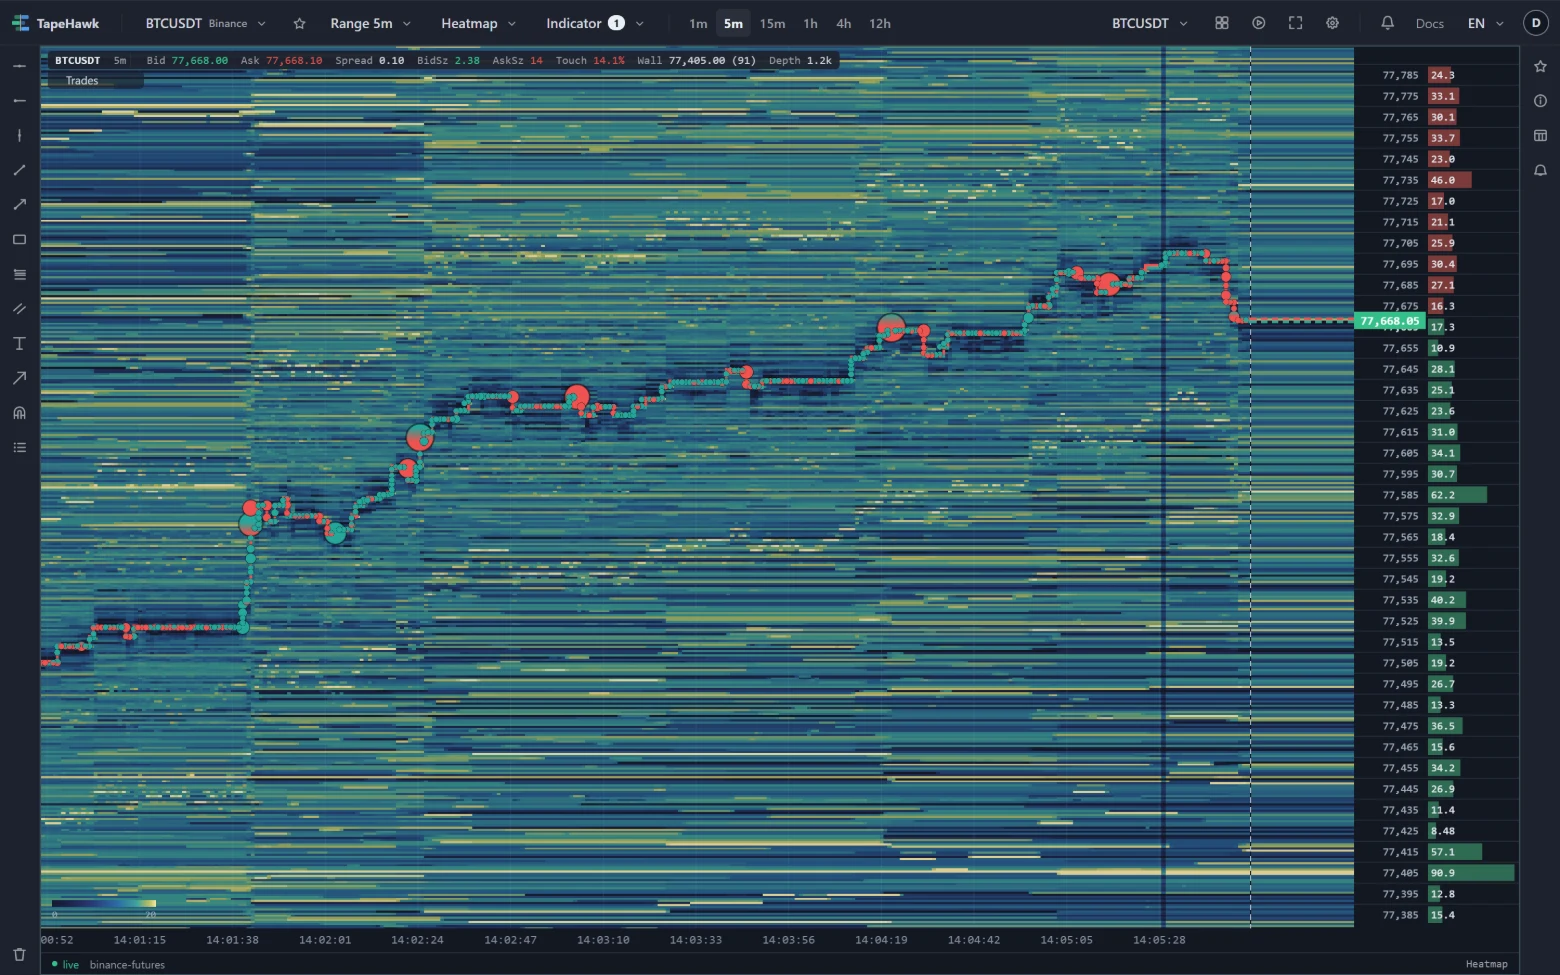
TapeHawk is a real-time order-flow chart for crypto futures, streaming Binance USDⓈ-M perpetual futures. It draws what a candle leaves out: where resting liquidity sits in the order book, how much volume traded at each price, and which side was the aggressor.
You can open the chart without an account. Signing in saves your layouts, drawings and favourite symbols. A confirmed email address adds the rest: more than one panel, alerts, and indicators you write yourself — see Access levels.
Three kinds of panel
Every panel on the chart is one of three kinds, picked from the Chart type menu in the toolbar, which applies to the panel you have selected. Chart types compares them.
- Heatmap draws the order book over time. Each row is a price level and each column is a moment; brightness is how much liquidity was resting there. Trades are drawn on top as bubbles, so you can watch liquidity being taken or pulled as price reaches it. A heatmap spans a time range rather than bars, and a layout shows one heatmap at a time.
- Footprint splits every bar by price level into the volume that sold at the bid and the volume that bought at the ask.
- Candles is the familiar price chart, in any of ten shapes: candles, hollow candles, Heikin Ashi, bars, line, area, step line, Renko, range bars and line break.
With a confirmed account, a layout can hold two or four panels side by side, each with its own symbol and chart type.
What else is on the chart
- Indicators — built-in studies for price, volume and order flow, drawn over price or in a band below it.
- Alerts — rules on price or on an indicator's signals. They arrive in the bell on the site and, if you allow it, as desktop notifications.
- Bar replay — pick a bar and play the market forward from there. While a replay runs you can paper trade it: place simulated market orders with a stop and a target, and review the trades you closed. Nothing is kept when you leave the replay.
- Custom indicators — write your own indicator as a short script in the editor. TapeHawk checks it and draws it on your chart.
The Terminal
Beside the chart there is a second screen, the Terminal at /terminal: a price table for every market, the same chart, the alerts and signals that fired, macro series, crypto headlines, a portfolio you enter by hand and two AI tools that answer from recorded data. It opens for everyone; your alerts, the signals, the news, the portfolio and the AI tools need a confirmed account.
How these docs are laid out
The sidebar follows the order you are likely to need things: getting started, the chart itself, the heatmap and footprint in depth, one page per indicator, then alerts, paper trading, the Terminal and custom indicators, and a FAQ at the end. Press Ctrl K (⌘ K on a Mac) to search every page.