Opening the chart
Open the chart without an account, pick a symbol, change what the panel draws, and move around the price and time axes.
The chart lives at /chart. You do not need an account to open it, and everything on this page works the same whether you are signed in or not.
What you see first
A first visit opens one panel: a Heatmap of BTCUSDT on Binance, looking back over the last five minutes. If you are signed in, your saved layout opens instead — see Panels and layouts.
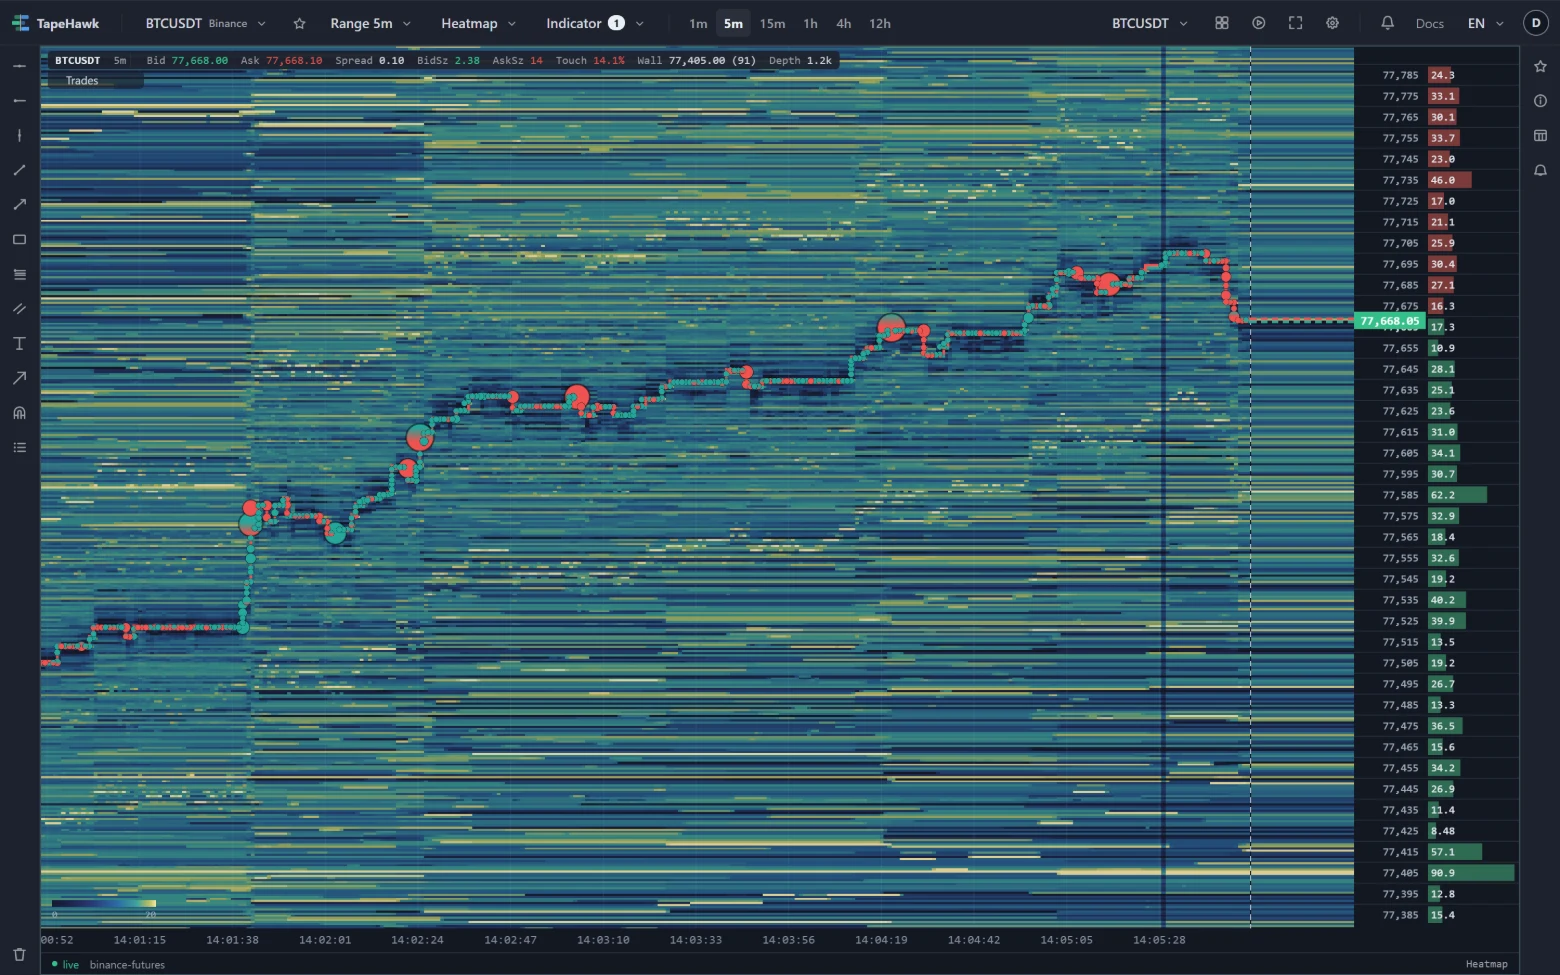
The screen has four parts:
- The toolbar across the top. Its left half — symbol, timeframe, chart type, indicators — applies to the panel you have selected. Its right half holds the controls for the whole workspace. The Toolbar page walks through every control.
- The drawing tools in a strip down the left edge. They need you to be signed in.
- The panel, with an info bar in its top-left corner (symbol, timeframe or range, live read-outs and the indicators on it) and a status strip along its bottom edge that says whether the data is live.
- The sidebar tabs down the right edge: favourites, instrument details, the data window and alerts.
Pick a symbol
Click the symbol box near the left end of the toolbar, just after the logo. It shows the symbol and, underneath, its venue.
- Type part of a symbol —
ETH,SOL— to narrow the list. Matching is on any part of the name. - Click a row to switch the selected panel to it.
The list starts with the symbols TapeHawk records in full, followed by the rest, and it shows the first 80 matches — type to reach the others. Symbols and venues explains why a few chart types are not available on every symbol.
Change what the panel draws
Open the Chart type menu, next to the timeframe. It lists Heatmap and Footprint first, then the ten shapes a candles panel can take, from Candles to Line break. Chart types describes each one.
To change the timeframe, use the Timeframe menu or the row of quick buttons after the indicator menu. A heatmap has no timeframe; it has a Range in the same place. See Timeframes and ranges.
Move around the chart
| To do this | Do this |
|---|---|
| Zoom in or out on time | Scroll the mouse wheel over the chart |
| Zoom the price scale | Scroll over the price axis on the right, or drag it up and down |
| Stretch or squeeze time | Drag the time axis along the bottom |
| Move through time and price | Drag the chart |
| Fit the price scale again | Double-click the chart |
| Go back to the newest bar | Click Scroll to realtime, which appears at the bottom right once you have scrolled away |
Scrolling back loads older history as you go, until the panel reaches the start of what is recorded; Data status lists what the panel says when it stops. On a touch screen, drag with one finger and pinch to zoom.
Share a chart
The address bar follows the symbol and chart type of the panel you have selected, so you can share a link that opens them:
/chart?symbol=ETHUSDT&type=footprintsymbol is the instrument and type is any chart type from the menu — heatmap, footprint, or one of
the candle shapes such as candle, hollow, hk, bar, line, area, step, renko, range or
linebreak. Opening the link puts that symbol and type on the selected panel, even over a saved layout.
The link does not carry the timeframe, the indicators or the other panels. A symbol whose name has Chinese
characters in it opens from a link like any other.
What is kept without an account
Without an account nothing is saved on TapeHawk's side. This browser remembers your colours and your timezone, and the symbol and chart type survive a reload because they are in the address bar. Everything else — indicators you added, timeframe, panel settings — goes back to the defaults when the page reloads. Saved layouts, drawings and favourites need an account: see Account and Access levels.