Panels and layouts
Show one, two or four panels, work with the selected panel, and keep several saved layouts.
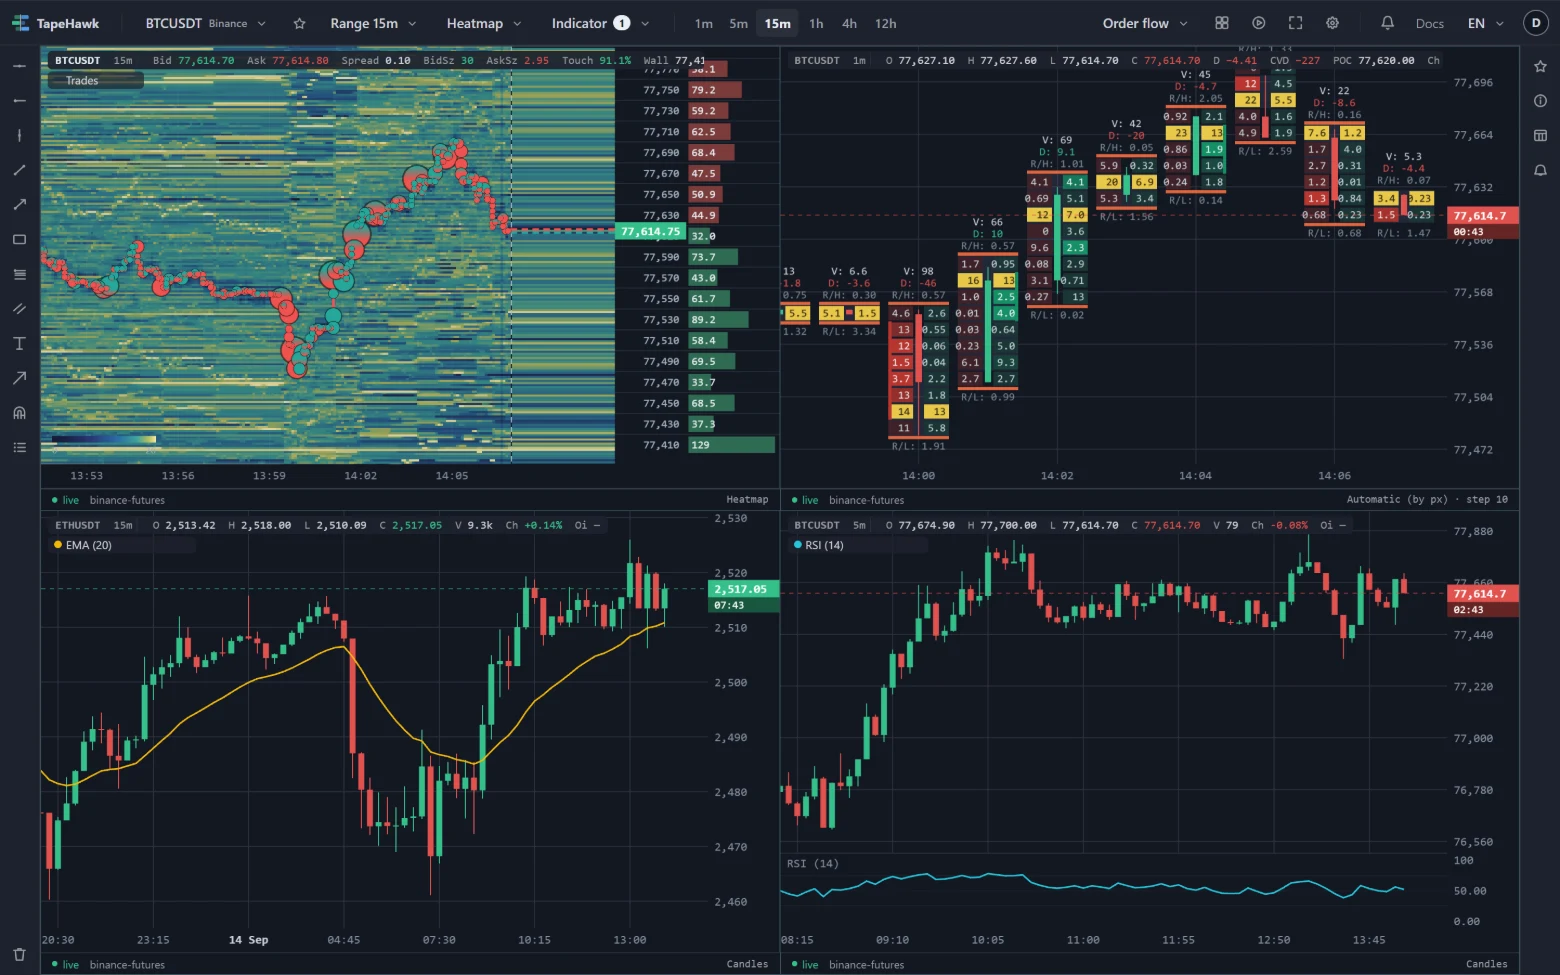
A panel is one chart: a symbol, a chart type, a timeframe or range, and its own indicators and settings. A layout is the whole workspace — how many panels it shows, what is on each, and the colours and timezone they share. Signed in, you can keep up to 20 layouts and switch between them.
One, two or four panels
Open the grid icon (Layout) in the right half of the toolbar and pick:
| Grid | Panels |
|---|---|
| 1×1 | One panel filling the chart |
| 2×1 | Two panels side by side |
| 2×2 | Four panels in a square |
The two larger grids need a confirmed account; for anyone else they carry a padlock. A phone always shows one panel. See Access levels.
A layout always holds four panels, even while the grid shows fewer. Going from 2×2 to 1×1 hides panels 2 to 4 without clearing them, and picking 2×2 again brings them back as you left them.
The selected panel
Click or press on a panel to select it. The selected panel's symbol is drawn in the accent colour in its info bar; the others are grey. Everything in the left half of the toolbar — symbol, star, timeframe, chart type, indicators — changes the selected panel, and so do the sidebar's read-outs and the panel half of the Settings popover.
Each panel has its own:
- symbol, chart type, timeframe or range;
- indicators, with their settings;
- panel settings — footprint rows and cells, heatmap threshold and contrast, trade bubbles, the Renko, range-bar and line-break sizes.
The whole layout shares candle colours, heatmap colours and the timezone.
Only one panel in a layout can be a heatmap. If you choose heatmap for a panel while another panel holds one, the chart refuses with One heatmap panel at a time — switch the existing one off first On a grid that is hiding panels, the hidden heatmap switches to candles instead, and a message says which panel changed.
Inside a panel
The info bar, in the top-left corner, starts with the symbol and the timeframe or range, followed by live read-outs for the chart type (Chart types lists them) and one row per indicator. Point at an indicator row to show its buttons:
- the eye hides or shows it without removing it;
- the gear, on indicators that have settings, opens them;
- ✕ removes it. If you changed any of its settings, the chart asks first, because they go with it. The trade bubbles of a heatmap have no ✕ — hide them with the eye instead.
On a touch screen, and in a browser window from 769 to 1100 pixels wide, the rows show no buttons: do the same from the indicator menu. The phone layout shows no indicator rows at all.
When the rows cover too much of the chart, collapse them with the arrow at the end of the first row. With a mouse on a wide window the arrow appears when you point at the list; on a touch screen, and from 769 to 1100 pixels wide, it is always there. The info bar then shows a coloured dot per indicator — four at most, then a count of the rest — and clicking it opens the list again.
The status strip, along the bottom edge, shows whether the data is live, the market the panel is on, and — on the right — either the chart type or a note about the data. Data status explains each state.
Saved layouts
Signed in, the Layouts menu sits at the start of the toolbar's right half and shows the name of the layout that is open. Your first layout is created for you, named Default.
- Everything saves automatically. There is no save button: each change to a panel, the grid, the colours or the timezone is written to the open layout as you go.
- Open another layout by clicking its name. The address bar then carries
?layout=and the layout's number, so two browser tabs can have two different layouts open without overwriting each other. - Save as — type a name in the box at the bottom of the menu and press Save as. This makes a copy of what is on screen under the new name and opens it; the layout you were in stays as it was when you last changed it.
- Rename with the pencil beside a layout's name, delete with its bin. The last layout cannot be deleted.
Names must be different from each other and can be up to 64 characters long. At 20 layouts the name box is disabled, and hovering Save as says
Layout limit reached (20)
What a layout keeps
| Kept in the layout | Kept separately |
|---|---|
| The grid and the selected panel | Drawings — saved per symbol and shown in every layout that opens that symbol |
| Each panel's symbol, chart type, timeframe and range | Favourites — one list for your account |
| Each panel's indicators, with their settings | Alert rules |
| Panel settings: footprint, heatmap, bubbles, candle shapes | |
| Candle colours, heatmap colours and the timezone |
In two tabs at once
A layout saved from another tab or device wins over this one. The next time this tab tries to save, it finds the newer version, loads it in place of your latest change, and says This layout changed in another tab — reloaded the newer version If the layout was deleted elsewhere, the tab keeps showing it but stops saving: This layout was deleted in another tab — changes are no longer being saved To keep what is on screen in that case, use Save as.