Sidebar
The four sidebar tabs — favourites, instrument details, the data window and alerts — and what each one reads.
A strip of four tab buttons runs down the right edge of the chart. Click one to open its panel beside the chart; the chart narrows to make room. Click the same tab again, or the arrow in the panel's header (Collapse sidebar), to close it.
The Details and Data window tabs describe the selected panel — the one whose symbol is in the accent colour — and follow when you select another. The sidebar is on the desktop only; on a phone, favourites are in the menu.
Favourites
This tab lists your favourite symbols as a table — symbol and venue, last price, and change over 24 hours. Click a row to switch the selected panel to that symbol, filter the list with the box at the top, and remove a symbol with its button. Add symbols with the star beside the symbol box in the toolbar.
Visitors see Sign in to keep a list of favourite symbols across your devices. and a sign-in link. More in Symbols and venues.
Details
This tab lists facts about the selected panel, in two groups.
Instrument
| Row | Shows |
|---|---|
| Symbol | The symbol |
| Venue | The exchange, such as Binance |
| Market | The exact market, such as binance-futures — the name to quote if you contact support |
| Tick | The smallest price step. It reads inferred when the venue's step is not known and the chart is working it out from the prices on screen |
View
| Row | Shows |
|---|---|
| Chart | Candles, footprint or heatmap |
| Timeframe or Range | The panel's timeframe, or its range on a heatmap |
| Connection | live, stale or offline — the same words as the panel's status strip (Data status) |
| History from | A dash on the markets TapeHawk carries today: their history reaches back further than the chart asks for |
Data window
This tab shows the numbers behind the newest bar or the live book, updated as they change.
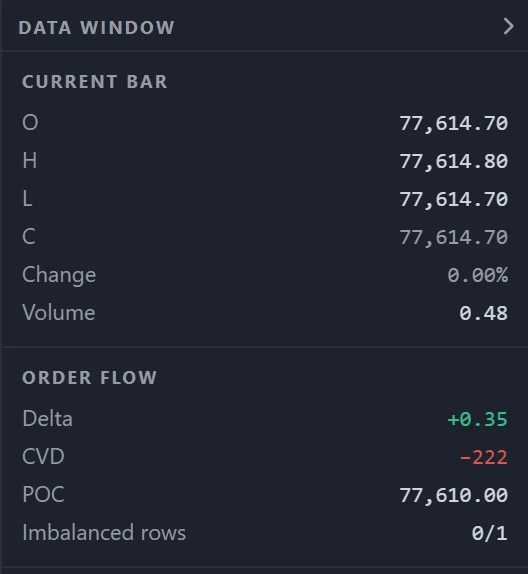
On a candles or footprint panel, Current bar shows the bar that is still forming: open, high, low, close, Change (from the bar's open) and Volume. A footprint panel adds Order flow:
- Delta — the newest bar's buy volume minus its sell volume;
- CVD — the running total of delta;
- POC — the price with the most volume in the rightmost bar on screen;
- Imbalanced rows — how many rows of that same bar are imbalanced, out of all its rows.
While you are scrolled back, POC and Imbalanced rows describe the older bar at the right edge of the panel; the other figures stay on the newest bar.
On a heatmap panel, Order book reads the live order book:
- Bid and Ask — the best prices, with the size resting at each;
- Spread — the gap between them;
- Largest level — the biggest resting level, with its size;
- Resting depth — the total resting size;
- Touch lean — the share of the size at the best bid and ask that sits on the bid. 50% is balanced; above 50% the book leans to the bid, below it to the ask.
On a wide heatmap panel these are measured over the rows of the order book ladder on screen; on a narrow one, over the whole book. Order book ladder spells out the difference. During a bar replay the rows show the recorded column at the cursor, the same book the ladder draws. While the panel shows history you have dragged into, the right edge is still live, so the tab keeps the live book. The info bar is the row that switches to the recorded span.
Alerts
This tab lists every alert rule on your account, whatever the panels show, each with buttons to pause, resume or delete it, and below them a form to create a new rule. The tab is there for everyone, but only a confirmed account has rules: signed out, it asks you to sign in, and on an account whose email is not yet verified, to verify it — see Access levels. Alerts explains the rules and the form.