Drawing tools
Place lines, shapes and notes on the chart, style and lock them, undo mistakes, and know where drawings are kept.
The drawing tools are a strip down the left edge of the chart (on a phone, behind the pencil in the bottom bar). They need you to be signed in; for visitors every tool shows a padlock, and clicking one says
Sign in to use the drawing tools
The tools
| Tool | Points | Use it for |
|---|---|---|
| Horizontal line | 1 | A price level across the whole chart |
| Horizontal ray | 1 | A price level from a point onward to the right |
| Vertical line | 1 | A moment in time |
| Trend line | 2 | A line between two points |
| Ray | 2 | A line from a point, through a second, onward |
| Rectangle | 2 | A zone between two corners |
| Fibonacci | 2 | Retracement levels between a high and a low |
| Parallel channel | 3 | Two parallel lines: a base line, then the width |
| Text | 1 | A note of up to 200 characters |
| Arrow | 2 | An arrow from one point to another |
| Fixed range volume profile | 2 | The volume traded at each price between two moments — see below |
After the tools come the magnet, the objects list, and Clear all objects.
Place an object
- Click a tool. The pointer becomes a crosshair.
- Click the chart once for each point the tool needs. For Text, type the note and press Done or Enter.
- The object is placed and the tool is released. Click the tool again for another one.
Press Esc to give up on an object halfway through, or click the armed tool again.
Magnet
With the magnet on, every point you place lands on the open, high, low or close of the bar under the pointer — both the price and the time snap, so the point sits exactly on the candle. Turn it off to place points freely. A heatmap panel has no candles to snap to, so the magnet is unavailable there:
Magnet needs candles; a heatmap panel has none
Change an object
Click an object to select it. Drag it to move it, or drag one of its handles to reshape it. A gear appears beside the selected object; click it for the style editor:
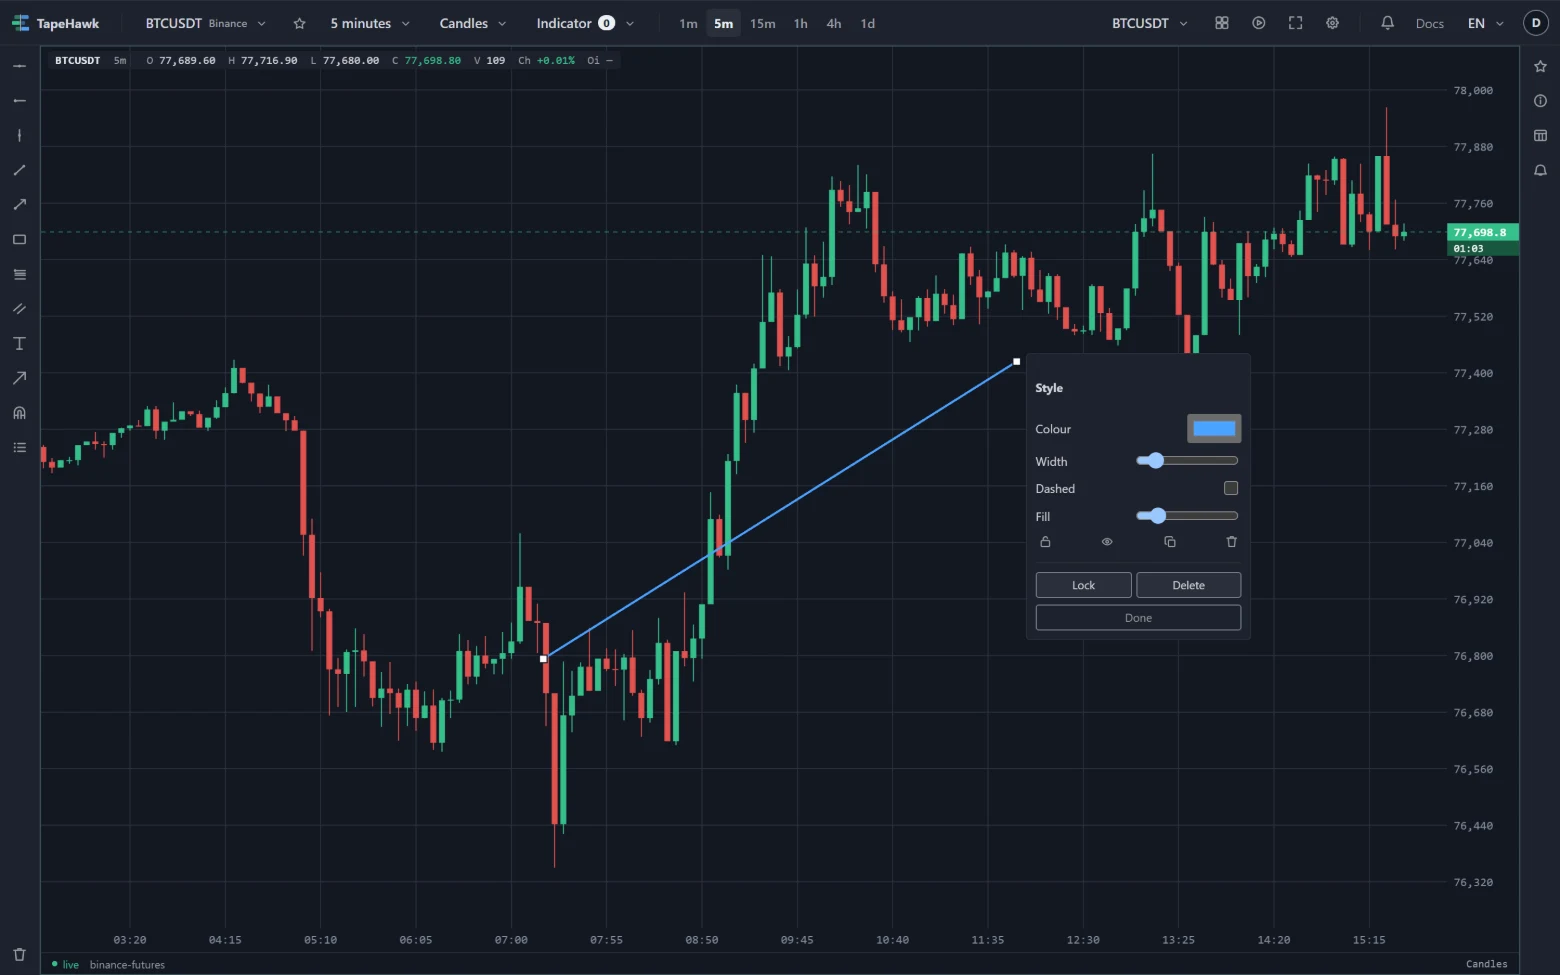
- Colour, Width, Dashed and Fill (how opaque the inside of a rectangle or channel is);
- Lock — a locked object cannot be selected or moved on the chart, so dragging over it pans the chart instead;
- Hide — the object stays saved but is not drawn;
- Duplicate — a copy on top of the original, selected, ready to drag away;
- Delete.
Click an empty part of the chart to deselect.
The objects list
Locked and hidden objects cannot be clicked on the chart, so the list button in the tool strip opens Objects: every object on this symbol, top-most first, each with show or hide, lock or unlock, and delete. Click an object's name to select it. The list is on the desktop only.
Fixed range volume profile
Fixed range volume profile takes two points and draws, inside the stretch of time between them, how much volume traded at each price — the same histogram, POC and value area as the Volume Profile indicator, over a range you choose instead of a session. The range runs from the first point's candle to the second point's candle, both included. The points' prices only place the box until the volume loads; the profile covers every price traded in the range.
Its style editor adds the profile's own settings: Price step (ticks), Value area (%), Width (% of range), Bar type, Colour mode, Volume nodes, and Level lines — Across the range, Inside the profile, or On to the right edge to carry the POC and value area forward. Colour is the colour of the POC and value-area lines.
- The volume comes from the stored order flow: the last 30 days, up to 32 days in one range. A range outside that, or on a symbol whose order flow is not stored, says so inside the box instead of drawing nothing.
- When the stored bars start after or end before the range, a line inside the box says what the profile covers.
- A range that reaches the current candle refreshes once a minute; the candle still forming is not included until it closes.
- Moving or resizing the range loads the new one once it has held still for a moment.
- Without a fill, only the range's two edges and the histogram grab the drawing; the rest of the box pans the chart as usual.
Keyboard
| Keys | What happens |
|---|---|
| Esc | Cancels the object you are placing, or deselects, and releases the tool |
| Delete or Backspace | Deletes the selected object |
| Ctrl Z | Undoes the last change on this symbol's drawings |
| Ctrl Shift Z or Ctrl Y | Redoes it |
On a Mac, ⌘ works in place of Ctrl. Shortcuts are ignored while you are typing in a text box.
Undo and redo act on the symbol of the selected object, so select any object on that chart first:
- Deleting an object also clears the selection. To undo a delete, select another object on the same symbol, then press Ctrl Z. Deleting the last object on a symbol, or Clear all objects (which asks first), leaves nothing to select. To undo it anyway, pick a two-point tool such as Trend line, click the chart once, press Ctrl Z, then Esc to drop the line you started.
- Undo goes back up to 20 steps, for the five symbols you edited most recently, until the page is reloaded.
During a bar replay, Esc that deselects an object or releases a tool also ends the replay.
Where drawings are kept
Drawings belong to a symbol on a venue, not to a panel or a layout. A line drawn on BTCUSDT appears on every panel showing BTCUSDT — whatever its chart type, timeframe or layout — and on every device you sign in on. Because objects are stored by price and time, they stay on the same prices and moments when you change the timeframe.
Changes save by themselves a moment after you make them. If another tab has saved newer drawings for the same symbol, or cleared it, this tab loads what that tab saved instead of saving over it, and says Drawings changed in another tab — reloaded The change this tab was trying to save is dropped; your next change saves normally.
Limits
- One symbol holds up to 300 objects, within a size cap that long notes reach sooner. Past either, changes on that symbol stop saving and the chart says These drawings are too large — delete some objects before adding more Deleting objects resumes saving; adding more does not.
- Your account keeps drawings for up to 50 symbols. A symbol counts from the first object you draw on it until its last object is deleted or you clear it. Past 50, drawings on a symbol that has none yet are not saved and the chart says Drawing storage limit reached — clear drawings on another symbol Clear the drawings on another symbol, then change something on this one: it saves again.