Chart types
The three kinds of panel — candles, footprint and heatmap — what each one draws, and the rules for switching between them.
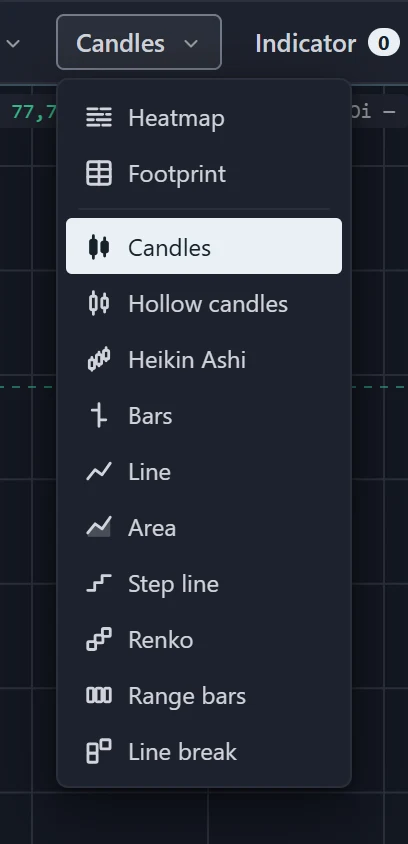
Every panel is one of three kinds. You pick it from the Chart type menu in the toolbar, which changes the selected panel. The menu lists Heatmap and Footprint first, then — below a divider — the ten shapes a candles panel can take. Picking any of the ten makes the panel a candles panel in that shape.
| Candles | Footprint | Heatmap | |
|---|---|---|---|
| Draws | Price bars | Price bars split by price level | The order book over time, with trades |
| Axis | Timeframe, 13 widths | Timeframe, 4 widths | Range, 6 spans |
| Info bar | Open, high, low, close, volume, change | Adds delta, CVD, POC and imbalance count | Best bid and ask, spread, the sizes and their lean at the touch, the largest resting level, total depth |
| Symbols | All | All; on a live-only symbol, only the last half hour or so of history | All; on a live-only symbol, live from when you open the panel, with no history |
| Per layout | Any number | Any number | One |
Candles
The familiar price chart: one bar per timeframe, with the venue's open, high, low, close and volume. Beyond classic candles it can be drawn as hollow candles, Heikin Ashi, bars, line, area, step line, Renko, range bars or line break — see Candle shapes.
Candles work on every symbol in the list and on all thirteen timeframes.
Footprint
A footprint panel is a candle chart that opens every bar up by price. Each row of a bar is one price level, and each row shows the volume that traded there, split by side: sellers hitting the bid and buyers lifting the ask. You can see at which prices a bar did its business, where one side overwhelmed the other, and where volume was heaviest.
The info bar adds four order-flow read-outs to the price: D, the newest bar's delta (buy volume minus sell
volume); CVD, the running total of delta; POC, the price with the most volume; and Imb, how many rows
are imbalanced. POC and Imb read the rightmost bar on screen, so while you are scrolled back they describe
that older bar.
On a live-only symbol the footprint reaches back only about half an hour, rebuilt from the exchange's recent trades, and fills in live from there.
Footprint offers four timeframes — 1m, 5m, 15m and 1h. How rows are grouped, what a cell shows and how it is coloured are set in the Settings popover while the footprint panel is selected. The Footprint section covers reading one in depth.
Heatmap
A heatmap draws the order book over time. Each row is a price level and each column is a moment; the brighter a cell, the more size was resting at that price. Trades are drawn over it as bubbles — sized by volume, coloured by the aggressor's side — so you can watch liquidity get taken or pulled as price reaches it. A line traces the best bid and ask, and a live ladder of the current book sits beside the price axis.
A heatmap takes a Range instead of a timeframe — how much time the panel spans; see Timeframes and ranges. Its threshold, contrast, colours and bubble settings are in the Settings popover. The Heatmap section covers reading one in depth.
Two rules apply to heatmaps only:
- One heatmap per layout. A heatmap holds a lot of data in the browser, so a layout can show one at a time. Choosing heatmap on a second panel is refused with One heatmap panel at a time — switch the existing one off first
- It needs a recorded order book. On a symbol whose order book TapeHawk does not record, the panel stays empty and says so — see Recorded symbols and live-only symbols.
Switching kinds
Changing the chart type keeps the panel's symbol, its drawings and every indicator you added. An indicator that cannot be drawn on the new kind stays in the indicator menu marked (not drawn here), still counts toward the panel's limit of 16, and draws again when you switch back. Remove it from the menu if you no longer want it.
The timeframe follows the kind: a candles panel on a timeframe that footprint does not offer moves to 1h when it becomes a footprint panel. A heatmap does not use the timeframe at all, so switching from a heatmap back to candles or footprint returns to the timeframe the panel had before — except that a footprint panel still moves to 1h if that timeframe is not one of its four.
Timeframes and ranges
Which timeframes candles and footprint panels offer, why a heatmap takes a range instead, and what happens to the width when you change chart type.
Candle shapes
The ten ways a candles panel can draw price, what each one shows, and what changes on Renko, range bars and line break.