Heatmap overview
What a heatmap panel draws — the order book over time, the touch, trades and the live book — and how to move through its recorded history.
A heatmap shows the order book as it has stood over time. Price runs up the side, time runs across, and every cell is coloured by how much size was resting at that price at that moment. Where a candle tells you where price went, a heatmap shows what was waiting for it there.
To open one, pick Heatmap in the Chart type menu. A layout holds one heatmap, and it needs a symbol whose order book TapeHawk records — see Chart types.
What is on the panel
Reading from left to right:
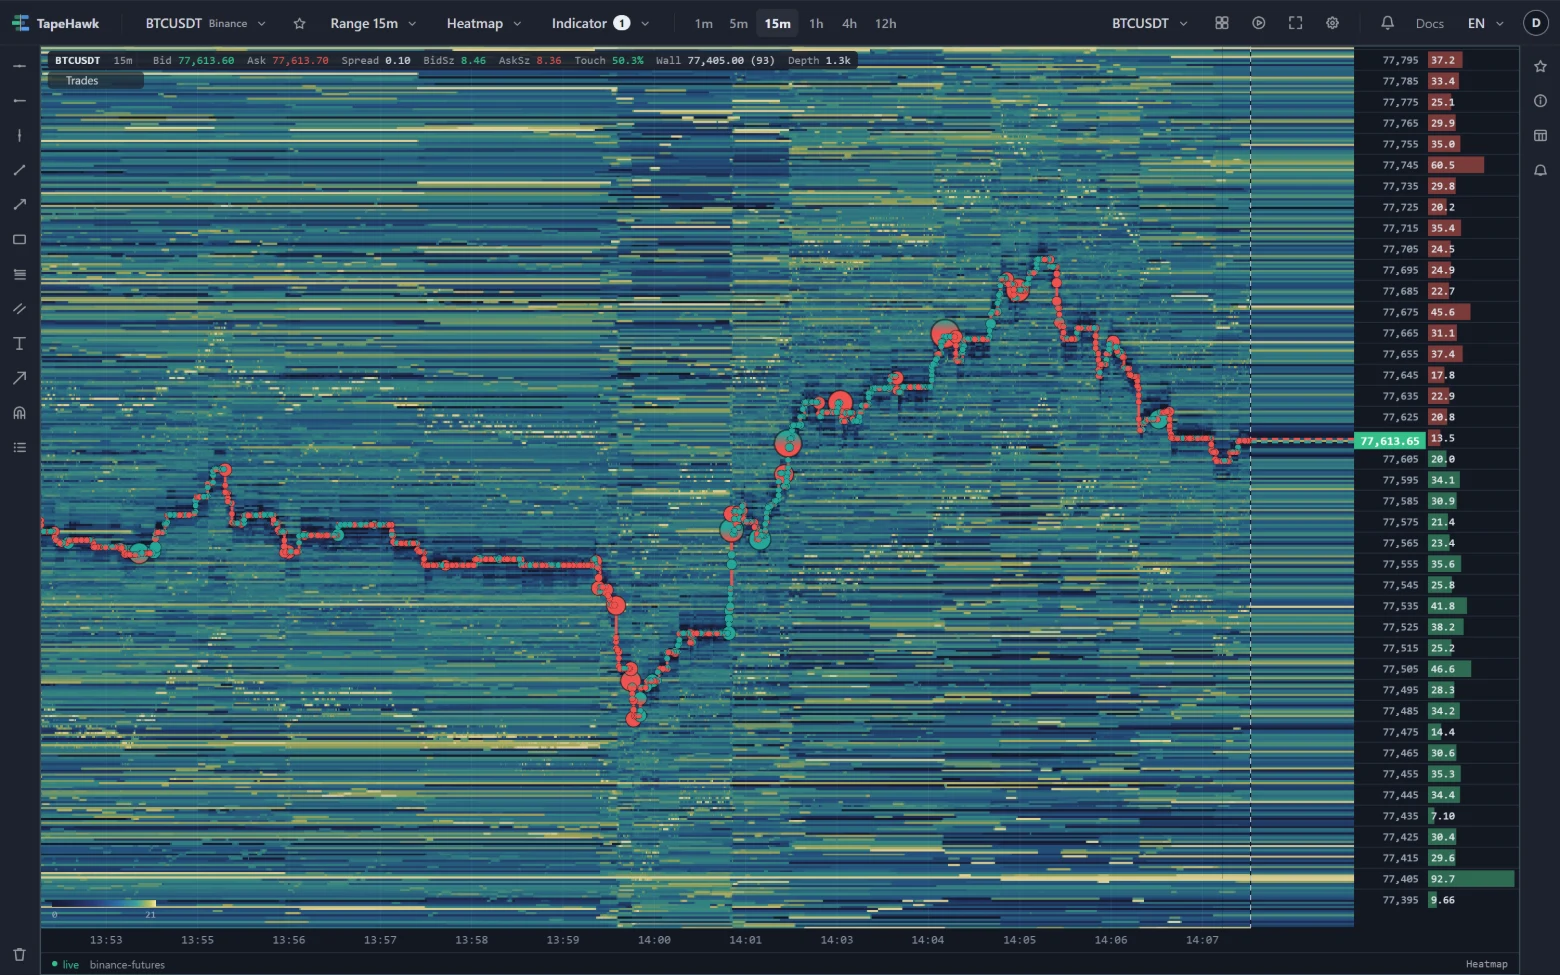
- The heat field — the recorded book. Each column is a slice of time and each row a price band; the brighter the cell, the more size rested there. Reading liquidity explains the colours.
- The bid and ask trace — two stair-steps, green for the best bid and red for the best ask by default, so you can see where the touch was at every moment.
- Trade bubbles — the trades that executed, drawn at their price and time, sized by volume. See Trade bubbles.
- The live edge — a pale vertical line after the newest column. To its right, the book as it stands right now is painted in the same colours, so a level that is still resting runs on as an unbroken band up to the price axis (on very narrow panels this band is left out). Dashed leads carry the current bid and ask to the axis.
- The price axis and the order book ladder — on a wide enough panel, the axis becomes a ladder of prices with the size resting at each. See Order book ladder.
A small colour key along the bottom of the plot reads from little resting size to a lot.
Range and columns
A heatmap takes a Range — 1m, 5m, 15m, 1h, 4h or 12h — instead of a timeframe: how much time the field spans across the panel. Each column covers a slice of that time sized to fit the width of the panel, so a column on a 12h range covers far more time than one on 1m.
The newest column is still forming and shows the live book. Every closed column shows the book averaged over the time the column covers.
Timeframes and ranges covers what the status strip says while the recording fills a long range, or when the panel is too narrow for it.
The info bar
The panel's info bar reads the live book instead of a price bar: Bid and Ask, the Spread between them,
the sizes at each (BidSz, AskSz), Touch — the share of that size sitting on the bid — Wall, the
largest level with its size, and Depth, the total resting size.
Order book ladder explains exactly what each one measures,
and the data window shows the same figures with their names spelled out.
On a phone there is no info bar; the top bar shows the middle of the book.
If you hide the trade bubbles, the info bar says so: Trade prints off
Going back in time
Drag the heatmap to the right — pulling older columns in from the left — to scroll into its recorded history. Older stretches load as you drag, and the panel tells you what it is doing:
- the status strip shows loading recorded history… while a stretch loads and end of history — 24 hours is all that is kept at the oldest recorded book;
- if a stretch could not be fetched it shows history paused — retries by itself if the service was busy, otherwise drag again. When TapeHawk was busy or could not be reached, it asks again by itself after a short wait — longer after repeated failures, up to a minute — as long as the view is still at the left edge of what has loaded; otherwise drag again to retry;
- the info bar replaces the live read-outs with the stretch of recorded book the panel holds, for example recorded · 10:05–10:20, because the live figures would not describe what you are looking at;
- the range is fixed while you are in the past — resizing the panel does not change it.
Click Scroll to realtime to return to the live edge. A heatmap also replays its recorded book during a bar replay.
Indicators on a heatmap
On a heatmap panel, the Order flow group of the indicator menu lists the indicators that read the order book and the tape: detected events such as absorption and sweeps are marked on the field, and book indicators draw in a band below it. The trade bubbles are one of them, Trades, switched on by default.
Colours and settings
The settings popover — candle colours, colour presets and timezone for the workspace, then the settings of the selected panel.
Reading liquidity
What the colours of the heat field mean, how to see liquidity being added, pulled and traded, and how to tell thin liquidity from missing data.