Colours and settings
The settings popover — candle colours, colour presets and timezone for the workspace, then the settings of the selected panel.
Click Settings (⚙) in the right half of the toolbar. The popover has two parts: settings for the whole workspace at the top, and below a heading such as Panel 1 · BTCUSDT · Heatmap, the settings of the selected panel. Changes apply as you make them — there is nothing to confirm. The popover is on the desktop only.
For the whole workspace
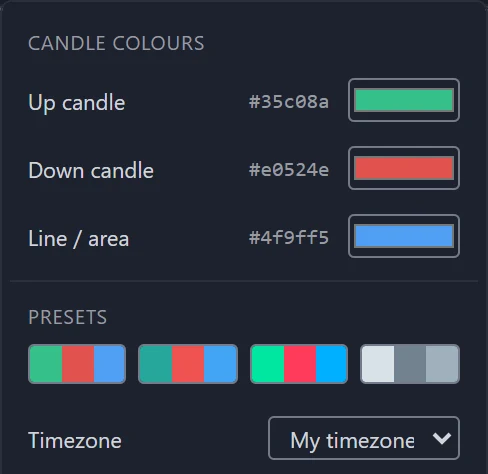
Candle colours
Three colours used by every panel:
- Up candle — bars that closed at or above their open;
- Down candle — bars that closed below it;
- Line / area — the line of the line, area and step-line shapes.
Click a swatch to pick any colour. Under Presets, four ready-made schemes set all three at once — Classic, Bookmap, High contrast and Monochrome, as swatches (hover one for its name).
Timezone
The Timezone list sets the clock every time axis, crosshair label and replay clock reads in:
My timezone (the default — your computer's clock), UTC, Ho Chi Minh (UTC+7), Tokyo (UTC+9), Hong Kong (UTC+8), Dubai (UTC+4), London or New York.
One timezone for the whole workspace keeps the same moment at the same label on every panel.
For the selected panel
What appears here depends on the panel's chart type. A plain candles panel has nothing of its own, so only the heading shows.
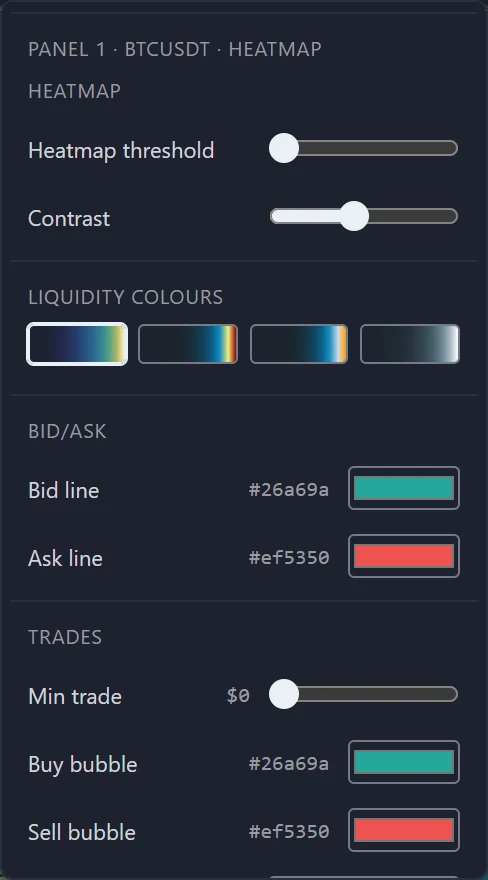
Heatmap
- Heatmap threshold — the smallest resting size drawn at all. Raise it to hide thin liquidity and leave only the larger levels.
- Contrast — where the top of the colour scale lands. Raise it to make mid-sized levels brighter; lower it to keep only the biggest levels bright.
- Liquidity colours — the colour scale itself: Classic, Bookmap 2, Bookmap 1 or Blue.
- Bid/Ask — the colours of Bid line and Ask line.
- Trades — Min trade hides trade bubbles smaller than the dollar value shown beside the slider; Buy bubble and Sell bubble set the bubble colours; the rest control how trades are grouped into bubbles and how bubbles are drawn.
Threshold, contrast, minimum trade and the bubble settings belong to this panel. Each is explained in Display settings and Trade bubbles. The heatmap colours — the scale, the bid and ask lines and the bubble colours — are shared by the workspace, like the candle colours.
Footprint
How a footprint panel groups price levels into rows, what each cell shows (bid and ask, delta, total volume and more), how cells are coloured, the value area and volume nodes, and the statistics grid under the bars. These belong to the panel; the Footprint section explains each of them.
Renko, range bars and line break
The brick size, the ticks per bar or the number of lines to break, under the shape's name — see Candle shapes.
Where settings are kept
| Setting | Signed in | Visitor |
|---|---|---|
| Candle colours, heatmap colours, timezone | In the open layout, and in this browser | In this browser |
| Panel settings | In the open layout | Until the page reloads |
Because the layout carries them, opening another saved layout brings its own colours and timezone with it. See Panels and layouts.
Data status
What the words in a panel's status strip mean — live, stale, offline, history gap — and the notes and warnings a panel shows when its data is incomplete.
Heatmap overview
What a heatmap panel draws — the order book over time, the touch, trades and the live book — and how to move through its recorded history.