Timeframes and ranges
Which timeframes candles and footprint panels offer, why a heatmap takes a range instead, and what happens to the width when you change chart type.
Candles and footprint panels are drawn in bars, so they take a timeframe — how much time one bar covers. A heatmap is drawn on a time axis measured in seconds, not in bars, so it takes a range — how much time the whole panel spans. The control in the toolbar changes to match the panel: a Timeframe menu for bars, a Range menu for a heatmap.
Candles
A candles panel offers thirteen timeframes:
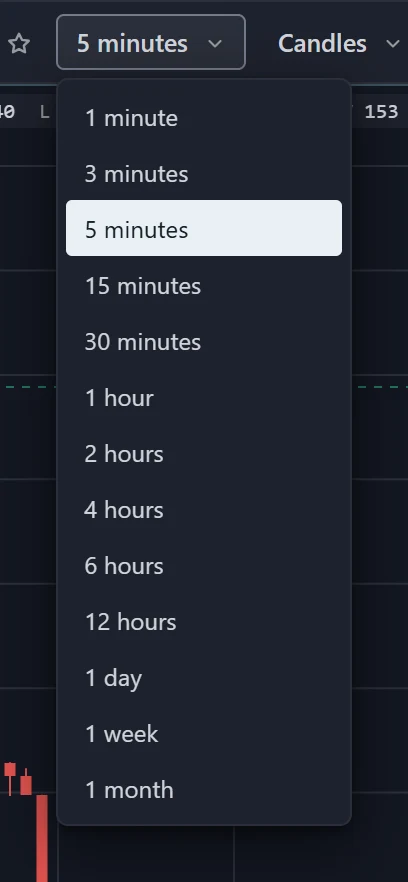
| Minutes | Hours | Days and longer |
|---|---|---|
| 1m, 3m, 5m, 15m, 30m | 1h, 2h, 4h, 6h, 12h | 1d, 1w, 1M (one month) |
The quick buttons in the toolbar cover 1m, 5m, 15m, 1h, 4h and 1d; the menu has all thirteen. The time axis is labelled in the timezone you choose in Colours and settings.
Footprint
A footprint panel offers four timeframes: 1m, 5m, 15m and 1h. These are the widths TapeHawk splits by price level, so the menu and the quick buttons show only these four.
If you switch a candles panel to footprint while it is on a timeframe footprint does not have — 4h, say — the panel moves to 1h. The order-flow indicators a candles panel offers have the same four widths, except Volume Profile, which draws at every timeframe: on any other timeframe they are not drawn, and the indicator menu marks them (unsupported timeframe).
Heatmap ranges
A heatmap offers six ranges: 1m, 5m, 15m, 1h, 4h and 12h. A range is the span of time from the left edge of the panel to the live edge on the right. The heatmap sets how much time each column covers so the whole range fits the width of the panel — on a longer range, each column covers more time.
- When the panel opens, a heatmap on a recorded symbol loads the recorded order book for the range. While the recording does not yet cover the whole range, the status strip shows how far it reaches, for example filling — 3m/5m, and the empty part of the plot is marked not recorded yet.
- If the panel is too narrow to draw the whole range, the status strip says how much of it fits. Make the panel wider — fewer panels, or full screen — or pick a shorter range.
Heatmap overview explains what the panel draws.
When the width changes
Changing the timeframe or the range reloads the panel for the new width. What stays the same: the symbol, the indicators, the drawings and the panel's settings. Drawings are stored by price and time, so a line drawn on 1m marks the same prices and moments on 1h.