Trade bubbles
How executed trades are drawn on the heatmap, what a bubble's size and colours mean, and the settings that group trades into bubbles.
Trade bubbles put the executed trades on top of the order book: each bubble sits at the price and time the trades happened, grows with how much traded, and shows how much of it was buying versus selling. Read together with the heat field, they show whether resting size was actually traded or simply pulled — see Reading liquidity.
Show or hide them
The bubbles are the Trades indicator in the Order flow group, and they are switched on for every new heatmap panel.
- Hide them with the eye on their row in the panel's info bar, or untick them in the indicator menu. The info bar then says Trade prints off
- They cannot be removed from a heatmap panel, only hidden.
What a bubble tells you
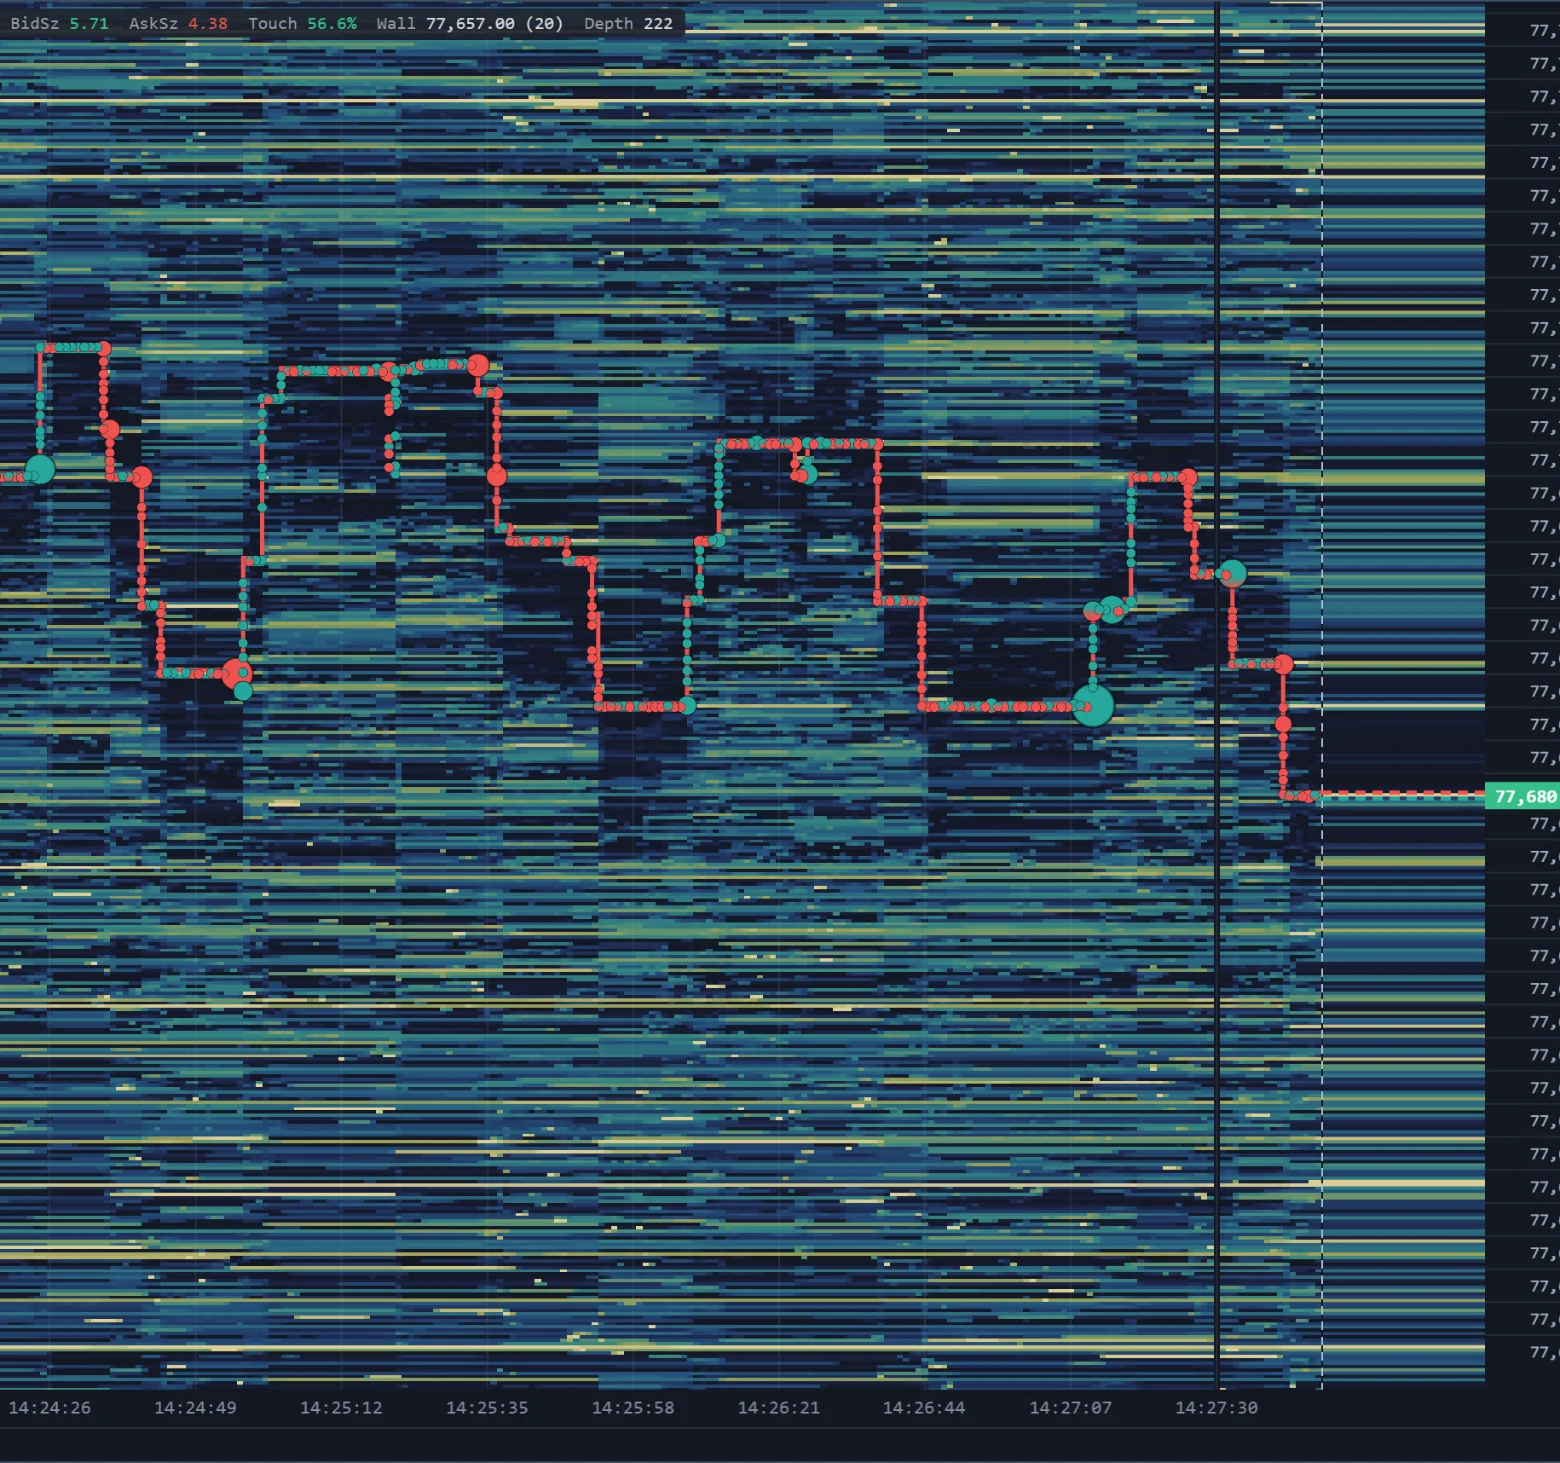
- Position — the average price of the trades in it, weighted by volume, at the time they traded.
- Size — the bubble's area grows with the volume it holds, compared with the largest trades the panel holds. The same trade can therefore look bigger on a quiet market than on a busy one; hover it for the figure.
- Colours — the share of the volume where the buyer was the aggressor, in the Buy bubble colour, against the share where the seller was, in the Sell bubble colour.
Hover a bubble to read it exactly: Trades with the total volume, the Buy and Sell split, and the value traded in dollars.
On long ranges, where columns are only a few pixels wide, each column shows only its largest bubbles so the field stays readable.
Settings
With the heatmap panel selected, open Settings (⚙). Under Trades:
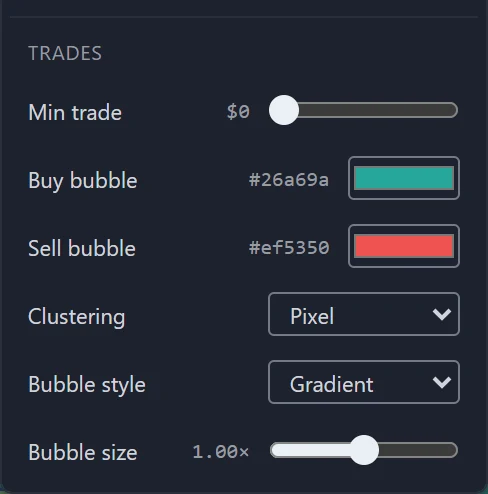
Min trade
Hides bubbles worth less than the dollar value shown beside the slider. The slider moves in finer steps at the low end, where most choices are. The filter is applied after trades are grouped, so a burst of small trades at one price still shows as the one bubble it adds up to.
Buy bubble and Sell bubble
The two colours of every bubble. By default they match the bid and ask trace, so a bubble sitting on a line reads as that side.
Clustering
How individual trades are grouped into bubbles:
| Mode | One bubble for |
|---|---|
| Pixel | Trades whose bubbles would overlap in the same column. The default. |
| Smart | The same, and also across neighbouring columns. Smart strength widens or narrows how close counts as overlapping. |
| By time | The trades of each stretch of time you set with Group span, from 100 ms to 10 s. |
| By volume | Each time the volume you set with Group volume has traded; what is left over carries into the next one. A single large trade can complete several at once and draws as one bigger bubble. |
| By price | A run of trades at one price, until the price changes. |
| By price + aggressor | A run of trades at one price by one side, until the price changes or the aggressor switches — roughly one bubble per sweep through a level. |
The first two group trades by what overlaps on screen, so zooming in separates bubbles that were merged. The other four group trades in the order they happened — and then, like the first two, bubbles that land at the same price in one column, or would overlap, are drawn as one. On longer ranges a column covers several seconds, so short spans and small volumes merge; pick a shorter range to see them apart.
Bubble style
How the buy and sell shares are painted on a bubble:
- Gradient — buy colour at the top blending into sell colour at the bottom.
- Solid — the same two colours with a hard edge where the buy share ends.
- Pie — the buy share as a slice, starting at twelve o'clock and running clockwise.
Bubble size
Makes every bubble smaller or larger than its normal size. It changes only how big bubbles are drawn, not which trades are grouped together.
The minimum trade and grouping belong to the selected panel; the bubble colours are shared by the whole workspace.
Reading liquidity
What the colours of the heat field mean, how to see liquidity being added, pulled and traded, and how to tell thin liquidity from missing data.
Order book ladder
The live order book beside a heatmap — the live-book band, the price ladder and Size column, and what the book read-outs measure.