Reading liquidity
What the colours of the heat field mean, how to see liquidity being added, pulled and traded, and how to tell thin liquidity from missing data.
The heat field answers one question: how much size was resting at this price, at this moment? It does not say who placed it or whether it will trade. Reading it well is mostly a matter of watching how bands of colour change as price comes near them.
Colour is size
Every cell is coloured on one scale, from transparent through the colours of the chosen palette to the brightest end, by the size resting in it. The small key along the bottom of the plot shows the scale, from zero to the size that reaches the top colour.
- Brighter is bigger. A bright horizontal band is a price where a lot of size sat for a while — often called a wall.
- Colour does not show the side. A cell above the ask trace holds offers to sell; a cell below the bid trace holds bids to buy. Near the touch a single band can hold both, which is why the bid and ask traces are drawn over the field.
- Each row is a price band, not always a single price. On longer ranges one row covers several ticks, and its colour is the size across all of them.
What counts as "bright" is set by two panel settings: Heatmap threshold hides cells with less size than it, and Contrast decides how much size reaches the top of the scale. See Display settings.
Read the number under the pointer
Hover a cell to see what its colour stands for:
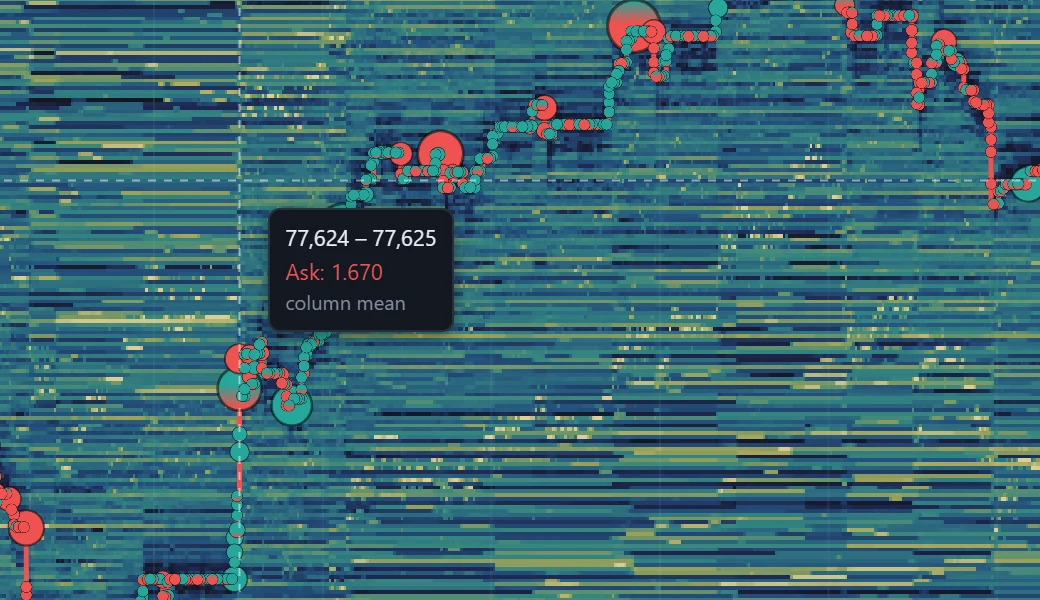
- the price band the cell covers, low to high;
- the size resting there, labelled Bid or Ask by which side of that moment's touch it sits on (or Size when that moment has no touch recorded);
- which measure it is: live book for the column still forming, column mean for a closed column, where the figure is the size averaged over the time the column covers.
Over a trade bubble, the same box adds what traded there — see Trade bubbles. Over a mark from an order-flow indicator, such as an absorption, it adds the event's name and side, Figure — the figure the mark's plate prints — and the time it happened.
What changes in the field mean
| What you see | What happened |
|---|---|
| A band appears and stays | Size was added at that price and left resting. |
| A band ends before price reaches it, with no bubbles printing there | The size was taken off the book — cancelled, not traded. |
| Price reaches a band, bubbles print there, and the band shrinks or ends | The resting size was traded into — consumed by aggressive orders. |
| Price reaches a band, bubbles print there, and the band holds | Trades hit the level but the resting size stayed, or was refilled as it traded. |
| A band keeps moving just ahead of price | Size is being re-placed as price approaches it. |
Bubbles can be missing where trades did print: Min trade hides small ones, and on long ranges each column keeps only its largest. Before reading a band as pulled, set Min trade back to the far left on a short range.
The field shows resting size; the bubbles show executed trades. Most of what is worth reading is the two together: whether size that was waiting at a price was actually traded when price got there, or disappeared first.
Thin liquidity or missing data?
A dark area is not always an empty book. Tell the two apart before reading anything into it:
- Thin liquidity — the cells near the touch still carry faint colour, and the bid and ask traces run straight through the area.
- No book data — a column or run of columns is empty from top to bottom, including at the touch, and the bid and ask traces break across it. That is a moment when TapeHawk received no order book — a dropped exchange connection, or your own connection to TapeHawk dropping — not a moment when nobody was quoting.
- Not recorded yet — on a long range the left part of the plot can be empty because the recording does not reach that far back. The plot says not recorded yet there, and the status strip shows how much of the range is filled.
If the whole panel stops changing, check the status word in the panel's status strip first — see Data status.
Heatmap overview
What a heatmap panel draws — the order book over time, the touch, trades and the live book — and how to move through its recorded history.
Trade bubbles
How executed trades are drawn on the heatmap, what a bubble's size and colours mean, and the settings that group trades into bubbles.