Order book ladder
The live order book beside a heatmap — the live-book band, the price ladder and Size column, and what the book read-outs measure.
The heat field is a record of the past — only its newest column is still forming. What is on the book right now is shown on the right-hand side of a heatmap panel, and in its info bar.
The live-book band
Between the newest column and the price axis, the book as it stands now is painted in the same colours as the field. A level that has been resting for a while runs out of the history as one unbroken band up to the axis, and the band ends the moment the size is pulled or traded.
A pale vertical line marks where the recorded columns stop and the live book begins, and dashed leads carry the current bid and ask across to the axis. When you drag back into history, the band slides off the right of the panel with the live edge. During a bar replay the band stays in its margin, to the right of that line, and shows the recorded column at the cursor — the same book as the Size column, not the book as it stands now. On very narrow panels the band is left out, so the field keeps the room.
The price ladder and the Size column
On a heatmap panel at least 640 pixels wide, the price axis turns into a ladder of two columns:
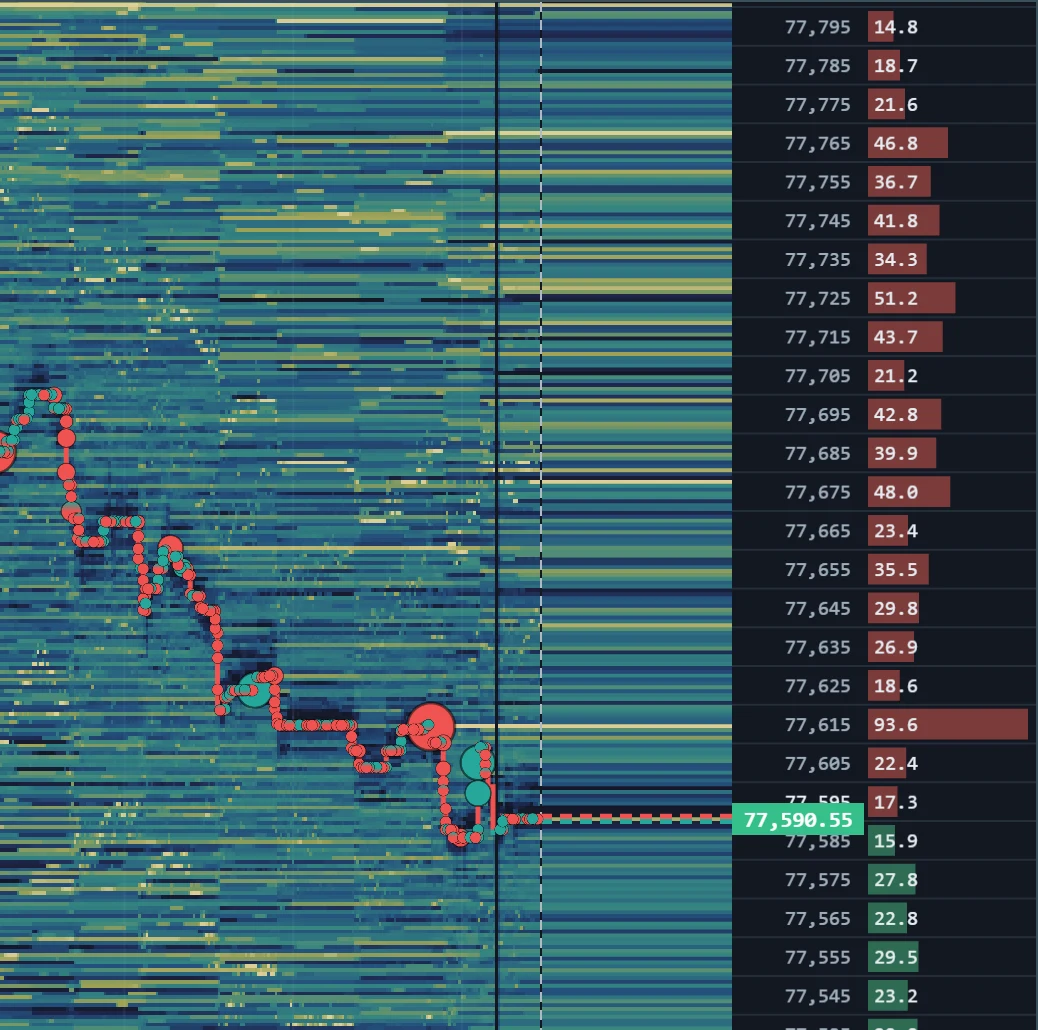
- Prices — one row per price level. The rows at the best bid and best ask are printed brighter, and a chip marks the current price.
- Size — the size resting at each row, as a bar and a figure: bid size below the middle of the book, ask size above it, in muted green and red.
The ladder's rows sit on the same price grid as the heat field, so a bright band on the left lines up with its row on the right. A ladder row needs room for a figure, so on long ranges — where the field's rows are only a pixel or two tall — one ladder row covers several of them.
On a narrower panel, or when a long range needs the whole width for the field, the ladder steps aside and the panel keeps an ordinary price axis. The live-book band stays longer, until the panel is much narrower or the range needs that room too.
While the heatmap plays a recorded book during a bar replay, the ladder shows the book recorded in the column at the replay cursor — prices and sizes from that column, not the book as it stands now. A closed column holds the bucket's time-weighted mean size. The info bar names the recorded span. A heatmap that has no recording to play stays on the live book throughout.
Book read-outs
The info bar of a heatmap panel reads the live book continuously. Some figures are measured differently depending on whether the ladder is showing:
| Field | With the ladder showing | Without the ladder |
|---|---|---|
Bid, Ask | The best bid and best ask prices | The same |
Spread | The gap between them | The same |
BidSz, AskSz | The bid size and the ask size in the ladder rows that hold the best bid and best ask — a row can span several prices | The size resting at the best bid and at the best ask |
Touch | Of BidSz and AskSz together, the share on the bid. 50% is even; above it the book leans to the bid | The same |
Wall | The largest ladder row on screen, with its size | The largest level in the whole book TapeHawk receives, with its size |
Depth | The total size in the ladder rows on screen | The total size of the whole book TapeHawk receives |
The Data window tab of the sidebar shows the same figures under full names — see Sidebar. While the panel shows recorded history or a replay, the info bar shows the recorded stretch instead, because a live quote would not describe the picture. During a bar replay the data window shows the same recorded column the ladder draws. While you have dragged into history the right edge is still live, so the data window keeps the live book.