Volume Profile
How much traded at each price over the current session, as a horizontal histogram split into bid and ask, with the point of control and the value area.
How much traded at each price across the whole session, drawn as a horizontal histogram.
- Candles
- 1m, 3m, 5m, 15m, 30m, 1h, 2h, 4h, 6h, 12h, 1d, 1w, 1M
- Footprint
- 1m, 5m, 15m, 1h
- Heatmap
- any range
- Not drawn on
- Renko, Range bars, Line break — This chart type has no time axis, so order-flow indicators cannot be plotted on it
- Alerts
- no
What it shows
A horizontal histogram inside the chart: one bar per price row, as long as the volume that traded at that price during the current session — today by default. Each bar is split into the volume sold at the bid and the volume bought at the ask: in their own colours inside the value area, in grey outside it.
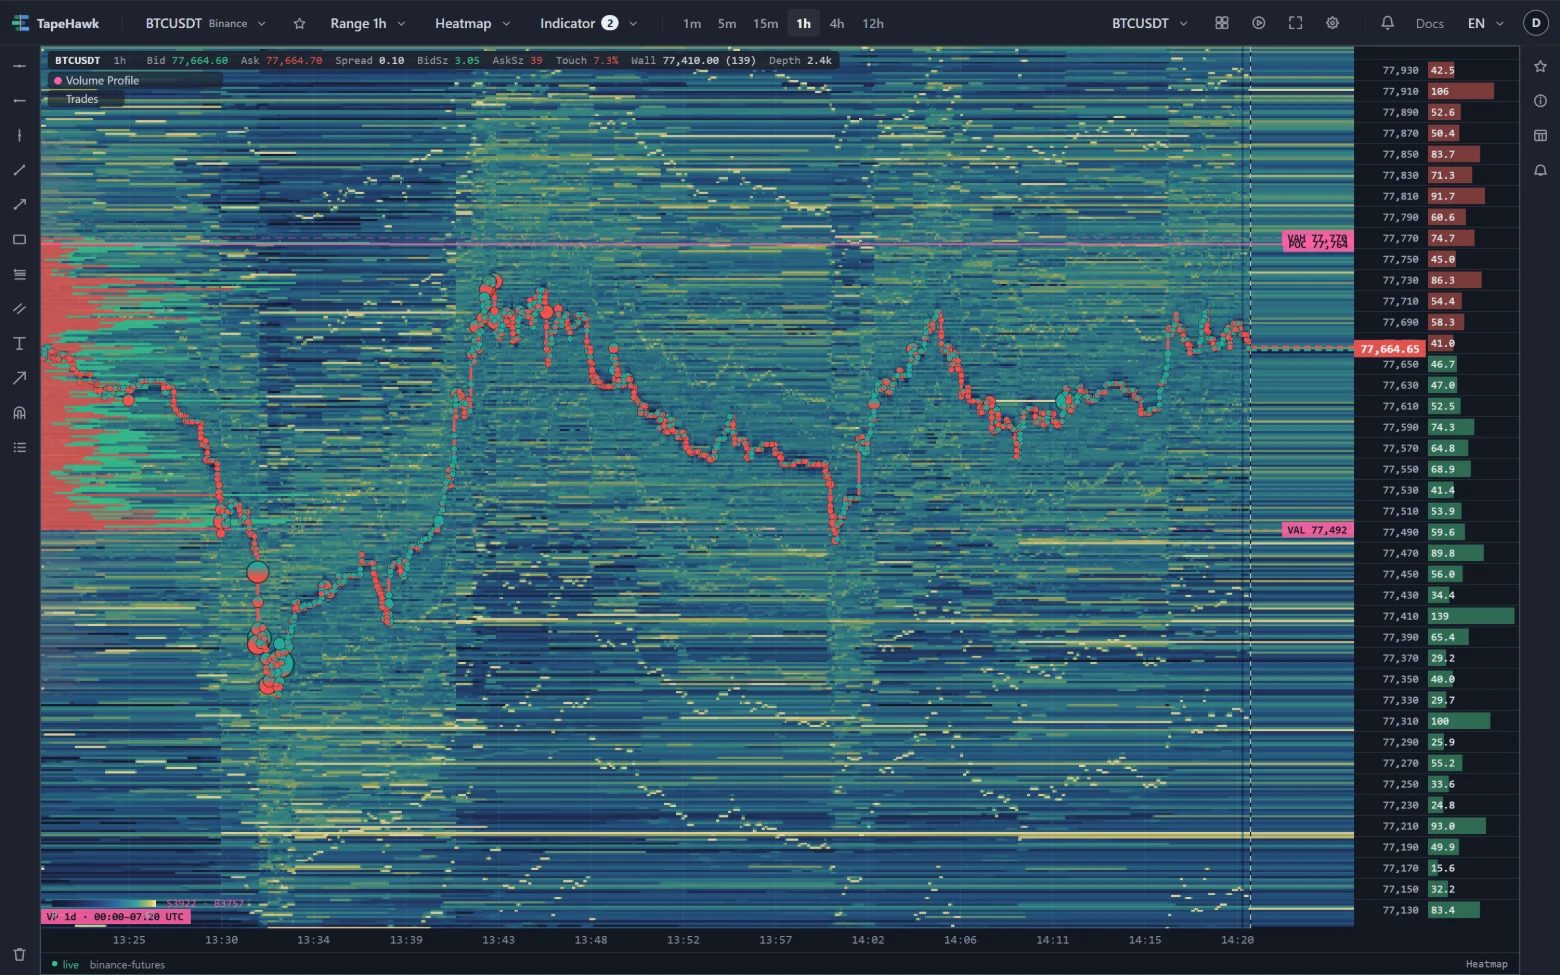
On top of the histogram:
- the point of control (POC), the busiest row, and the value area high and low (VAH, VAL) — the edges of the rows around the POC that hold most of the session's volume — are ruled across the whole chart with their prices beside them, and the value area is shaded;
- the traded size is printed at the end of the busier rows;
- a line of figures gives the session's total selling and buying, and a chip names the stretch of time the profile covers and its timezone.
The profile is fetched again every minute, so it grows as the session goes on. Early in a session it is thin: ten minutes into the day, it holds ten minutes.
How to read it
- The POC is the price the market traded at most this session — often a magnet when price drifts back, and a line buyers and sellers both watch.
- Inside the value area the market is trading where most of the session's business was done; leaving it, and holding outside, says the market is looking for new value.
- High-volume rows are prices where the market spent time and agreed on price; they tend to slow price down. Low-volume gaps between them are prices the market moved through quickly and can move through again.
- Bid against ask within a row shows which side was the aggressor there: a row mostly bought at the ask traded on buying, one mostly sold at the bid on selling.
- Volume nodes make the last two readings explicit. A high-volume node (HVN) is a band of prices where volume piled up — the market accepted price there, and it tends to hold price when it comes back. A low-volume node (LVN) is a band the market moved through quickly; price often crosses it fast again, and its edges are where a move out of a high-volume area tends to stall or speed up.
Bar types and colours
Bar type picks what each row draws:
- Bid / Ask — the default: selling at the bid and buying at the ask as two segments.
- Volume — one bar per row, the row's total.
- Delta — the net difference between buying and selling at each price, in the colour of the side that won. The bars are scaled to the largest difference in the session rather than to the busiest row, because net flow is usually a small part of total volume. With Split buyers and sellers on, buying grows one way and selling the other, from a line in the middle.
- Volume by delta — the total, tinted from grey toward the winning side's colour by how one-sided the row was.
Colour mode colours the rows: flat colours, Saturation (busier rows are more opaque), or Heatmap and Grayscale, which colour each row by its volume on the same scale the footprint uses and leave the side out.
Level lines decides whether POC, VAH, VAL and the node bands run across the whole chart or stop at the edge of the histogram.
Past sessions, several at once, and trading hours
Layout decides where profiles are drawn:
- Current session — the default: one profile beside the price axis.
- Every session — one profile inside each session's own stretch of the chart, so every day (or 4-hour block, or week) has its own histogram, sized to that stretch. The POC, VAH and VAL of a session that has finished are carried on to the right as dashed lines while price has not traded back at them (Naked POC ray); the moment it does, the line stops there. Recent sessions are shown — about a week of days, three days of 4-hour blocks — and the running one updates every minute.
With the single profile, Sessions back shows a finished session instead of the running one (1 is yesterday's day, last week's week…) and Sessions combined folds several consecutive sessions into one — 3 days, say. The window chip names the dates it covers.
From (hour) and To (hour) keep only the volume traded between two hours of each day, on the clock of the timezone you picked. With New York, 9.5 to 16 is the US cash session — the hours move with daylight saving on their own. A start later than the end wraps past midnight (22 to 6).
How the session developed, and its VWAP
Developing POC and value area draws where the POC, VAH and VAL stood at the end of each bar of the session, as steps along the time axis — the value area climbing with a trend, or the POC sitting still while price explores. The last step is the profile you see beside the price axis.
Session VWAP draws the volume-weighted average price of the same session, on the same timezone and trading hours as the profile, with bands Band 1 (σ), Band 2 (σ) and Band 3 (σ) standard deviations either side (0 hides a band). It is computed from the volume at each traded price, not from bar averages. Both start again at every new session; in the every-session layout each session has its own.
The standalone VWAP indicator resets on the UTC day; use this one when the profile is anchored to another timezone or to trading hours.
Volume nodes
Turn on Volume nodes to shade HVNs, LVNs or both. Two ways of finding them (Node detection):
- Local peaks — a row is a node when it is the busiest (HVN) or the emptiest (LVN) of the rows around it; Neighbours is how many rows on each side it has to beat. A price nobody traded counts as zero volume, and a run of untraded prices inside the profile is always one LVN, however wide.
- Percent of POC — every row above HVN threshold (%) of the POC is an HVN and every row below LVN threshold (%) an LVN. An LVN has to sit between busier rows, so the thin tails at the top and bottom of the profile are never marked.
Neighbouring rows of the same kind join into one band. Max nodes keeps the busiest HVNs and the deepest LVNs — the valleys that cut furthest below the busier rows on either side, which is the gap between two areas of value rather than the thin stretch near either end of the profile. The bands depend on Price step (ticks): with very small rows almost every bump is a local peak, so raise the step or the number of neighbours if the chart fills with bands.
Parameters
| Setting | Control | What it does |
|---|---|---|
| Session | Choice 4 hours · 8 hours · Day · Week (from Monday) · Month (up to 30 days kept) | How far back volume is folded. Every option starts at a fixed anchor, never a rolling window. default: Day |
| Timezone | Choice UTC · My timezone · Ho Chi Minh (UTC+7) · Tokyo (UTC+9) · Hong Kong (UTC+8) · Dubai (UTC+4) · London · New York | Which clock anchors the session. Not a display setting — a Tokyo day and a UTC day cover different bars. default: UTC |
| Price step (ticks) | Number | How many venue ticks fold into one row. Larger means thicker rows and fewer of them. 1–1000 · default 2 |
| Value area (%) | Number | Share of volume counted into the value area around the POC. The industry standard is 70. 50–100 · default 70 |
| Show VAH / VAL | On / off | Draws the upper and lower edges of the value area (VAH and VAL). |
| Width (% of plot) | Number | How far the bars may reach across the plot, as a percentage of its width. They grow from the left edge. 5–40 · default 25 |
| Colour | Colour | |
| Bid bar colour | Colour | |
| Ask bar colour | Colour | |
| Position (% of plot) | Number | How far the histogram has slid from its home edge. 0 keeps it there — the left edge when the bars grow right, the right edge when they grow left; 100 pushes it to the far side. 0–100 · default 0 |
| Direction | Choice Grow left · Grow right | Which way the bars grow, and therefore which edge they start from. default: Grow right |
| Split buyers and sellers | On / off | Draws bid and ask beside each other instead of stacking them into one bar. |
| Show numbers | On / off | Prints the traded size at the head of each bar. Only rows above a tenth of the largest are labelled. |
| Summary labels | Choice Bid B / Ask S · Bid S / Ask B · Bid ▲ / Ask ▼ · Bid ▼ / Ask ▲ · None | What the summary badge calls the two sides. The letter styles name the order side; the arrows leave the reading to you. default: Bid S / Ask B |
| Volume filter (%) | Number | Hides rows smaller than this share of the biggest one. The POC and the value area are found before the filter runs, so they can never be filtered away. 0–50 · default 0 |
| High volume lines | On / off | Rules the busiest levels right across the chart. Off by default, because the POC and the value area edges are already drawn. |
| Top levels | Number | How many of the busiest levels get a line. 1–20 · default 3 |
| Opacity (%) | Number | Dims the whole profile. It multiplies the existing shading rather than replacing it, so the value area stays readable. 10–100 · default 100 |
| Bar type | Choice Bid / Ask · Volume · Delta · Volume by delta | What each row draws: bid and ask volume, the row's total, the net difference between buyers and sellers, or the total tinted by which side won. default: Bid / Ask |
| Colour mode | Choice Solid · Saturation · Heatmap · Grayscale | Solid keeps flat colours. Saturation makes busier rows more opaque. Heatmap and grayscale colour each row by its volume and drop the side. default: Solid |
| Level lines | Choice Across the chart · Inside the profile | Whether POC, VAH, VAL and the node bands run across the whole chart or stop at the edge of the histogram. default: Across the chart |
| Volume nodes | Choice Off · High (HVN) · Low (LVN) · Both | Shades the price bands where volume clustered (HVN, where the market accepted price) or thinned out (LVN, prices it moved through quickly). default: Off |
| Node detection | Choice Local peaks · Percent of POC | Local peaks compares each row with its neighbours. Percent of POC marks every row above or below a share of the busiest row; a low node must sit between busier rows, so the thin tails do not count. default: Local peaks |
| Neighbours | Number | How many rows on each side a row must beat to count as a local peak or trough. Larger finds fewer, broader nodes. In both detection modes it is also how far an LVN looks for the busier rows it is ranked against. 1–20 · default 7 |
| LVN threshold (%) | Number | A row at or below this share of the POC's volume is a low-volume node. 1–50 · default 20 |
| HVN threshold (%) | Number | A row at or above this share of the POC's volume is a high-volume node. 50–100 · default 70 |
| Max nodes | Number | How many nodes of each kind are shown: the busiest HVNs first, and the LVNs that cut deepest between busier rows. 1–20 · default 5 |
| HVN colour | Colour | |
| LVN colour | Colour | |
| Layout | Choice Current session · Every session | Current session draws one profile beside the price axis. Every session draws one profile inside each session's own stretch of the chart, with the previous sessions' POC and value area carried forward while price has not returned to them. default: Current session |
| Sessions back | Number | Shows a finished session instead of the running one: 1 is the previous session, 2 the one before. Ignored by the every-session layout. 0–29 · default 0 |
| Sessions combined | Number | Folds this many consecutive sessions into one profile, ending at the one chosen above. Ignored by the every-session layout. 1–30 · default 1 |
| From (hour) | Number | Only counts volume traded between these two hours of each day, on the chosen timezone's clock. 0 to 24 is the whole day; with New York, 9.5 to 16 is the US cash session. A start after the end wraps past midnight. 0–24 · default 0 |
| To (hour) | Number | The end of the daily window above, in hours on the chosen timezone's clock. 0–24 · default 24 |
| Naked POC ray | On / off | In the every-session layout, carries each finished session's POC, VAH and VAL to the right until price trades back at that level. |
| Developing POC and value area | On / off | Draws how the POC, VAH and VAL moved through the session: each step is where they stood at the end of that bar. |
| Session VWAP | On / off | The volume-weighted average price of the same session and trading hours as the profile, with bands one, two or three standard deviations away. |
| Band 1 (σ) | Number | How many standard deviations the first band sits from the VWAP. 0 hides it. 0–4 · default 1 |
| Band 2 (σ) | Number | How many standard deviations the second band sits from the VWAP. 0 hides it. 0–4 · default 2 |
| Band 3 (σ) | Number | How many standard deviations the third band sits from the VWAP. 0 hides it. 0–4 · default 0 |
| VWAP colour | Colour |
Session picks how far back the volume is gathered. Every choice starts at a fixed boundary — the start of the 4- or 8-hour block, the day, the week from Monday, the month — never a rolling window. Timezone decides whose clock those boundaries are on: a Tokyo day and a UTC day cover different hours. Price step (ticks) groups the exchange's price steps into rows.
Value area (%) sets how much of the session's volume the value area holds, and Show VAH / VAL turns the POC, VAH and VAL lines on or off.
The look: Width (% of plot), Position (% of plot) and Direction size and place the histogram; Split buyers and sellers draws bid and ask side by side instead of end to end; Show numbers and Summary labels decide what the figures say; Volume filter (%) hides the smallest rows without moving the POC or the value area; High volume lines and Top levels rule the busiest levels across the chart with their totals; Opacity (%) fades the whole profile.
Limitations
- The single profile shows the session that is running now (or the one you shifted back to), whatever stretch of the chart you are looking at. During a bar replay it shows the session that contains the replay's starting point.
- Alerts on the POC, VAH and VAL always use the running session over the whole day: shifting back, combining sessions, trading hours and the every-session layout change what is drawn, not what an alert watches.
- Stored bars reach back 30 days, so the every-session layout and a shifted profile stop there; a profile shifted entirely past them says so instead of drawing.
- Trading hours and the every-session layout need a named timezone. With Local the chart says so rather than guessing which zone your browser is in.
- It is drawn only on symbols TapeHawk records. On a live-only symbol it stays empty.
- The newest minute is not in it yet: it covers the session up to the last closed minute.
- A month profile holds at most 30 days, which is how long TapeHawk keeps the bars it is built from.
- It cannot be drawn on Renko, range bars or line break.
VPOC
The volume point of control of every bar — the price that traded the most inside it — with rays from the levels price has not returned to.
Stop Volume Profile
Where stops went off, by price — a horizontal histogram of the size that went through the book in runs across several price levels, on a heatmap.