One-Side Pressure
How hard one side — buyers or sellers — is pressing, with older trades fading out, whoever is winning, in a band under the heatmap.
How hard ONE side is pressing, with older trades fading out. A market where both sides are huge and balanced reads as nothing on V-Delta and as a wall here.
- Heatmap
- any range
- Alerts
- no
What it shows
A line in a band under a heatmap for one side of the tape: the aggressive buying, or the aggressive selling, you choose. Each trade counts in full when it prints and then fades away, at the pace set by Half-life — the same fading V-Delta uses.
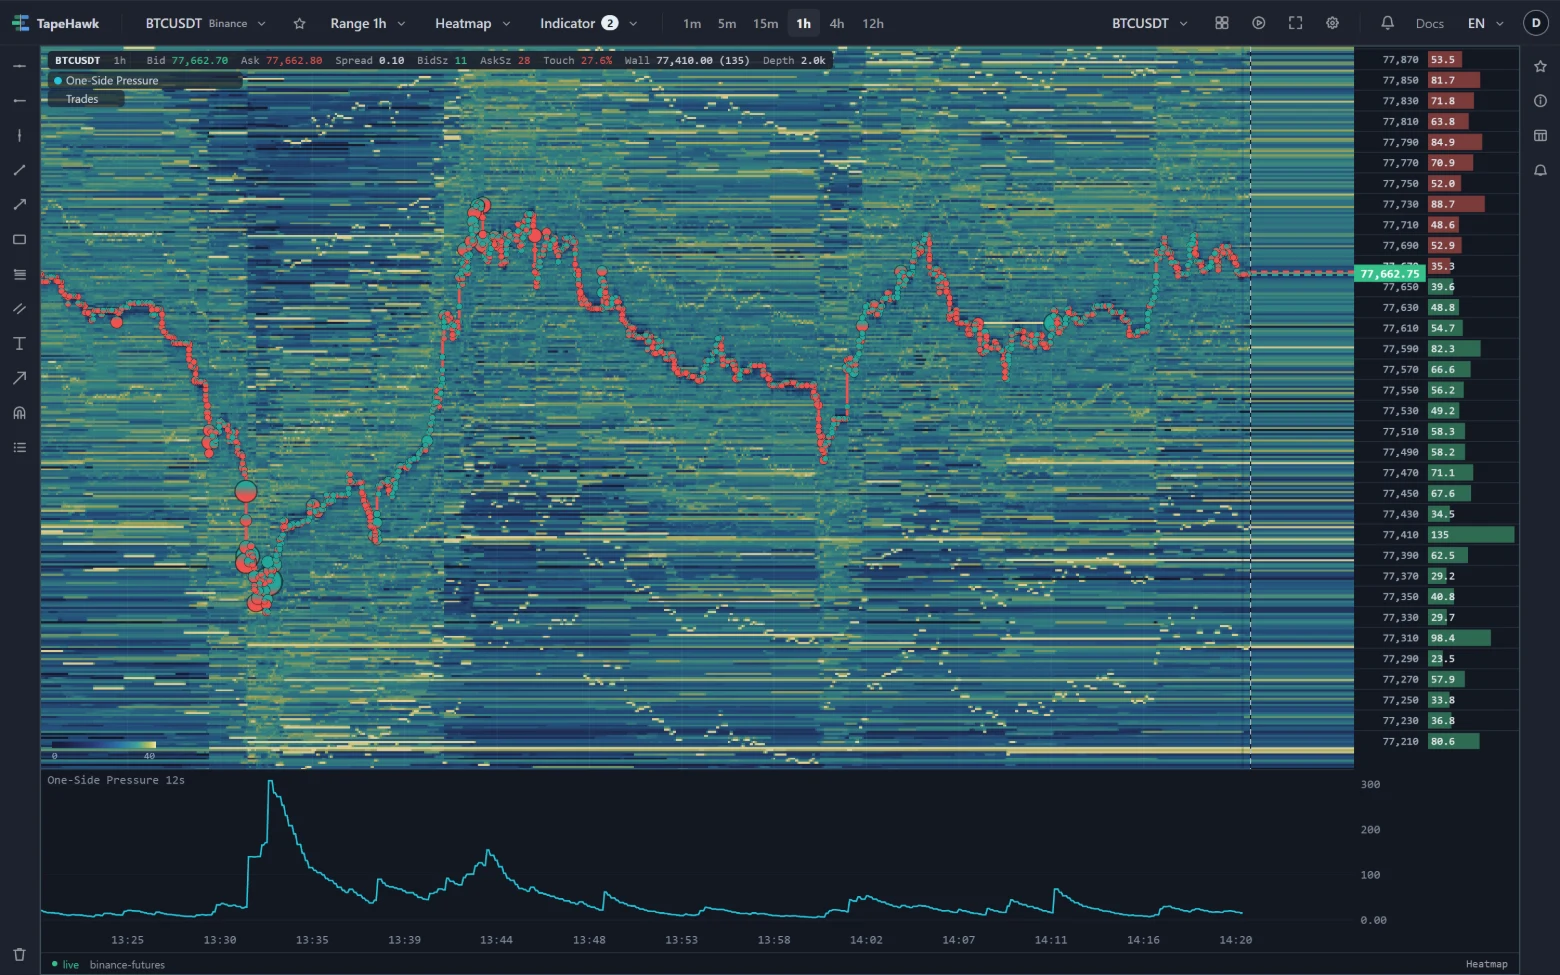
The two answer different questions. V-Delta subtracts one side from the other, so a market where both sides trade heavily and evenly reads as almost nothing there. This line shows that same market as heavy activity on the side you picked. It never goes below zero.
The heatmap draws it at the width shown beside its name, which follows the panel's range — or one minute, with CVD, RVOL or VPOC on the same panel.
How to read it
- Surges mark bursts of aggression from your chosen side, whether or not the other side answered them.
- Two copies — one set to buying, one to selling — show both sides at once; the menu takes several copies of an indicator. Heavy readings on both at the same moment describe a two-way fight at that price, which V-Delta alone would flatten to nothing.
- Fading pressure. The line dropping while price keeps moving in that side's direction says the move is running on less aggression than before.
Parameters
| Setting | Control | What it does |
|---|---|---|
| Side | Choice Buying · Selling | The default is set by TapeHawk; the settings dialog shows it. |
| Half-life | Choice 15 seconds · 30 seconds · 1 minute · 2 minutes · 5 minutes | The default is set by TapeHawk; the settings dialog shows it. |
| Units | Choice Volume · Share (%) | The default is set by TapeHawk; the settings dialog shows it. |
| Reference level | Number | Draws ONE dashed line at this value — not a mirrored pair, because this quantity has a floor of zero and no negative half. It marks a level to watch and arms nothing. 0 hides it. 0–100 · default 0 |
| Height (%) | Number | Height of the band, as a percentage of the panel. Dragging the band's edge changes it too. 8–50 · default 18 |
| Colour | Colour |
Side picks the side the line follows. Half-life sets how quickly trades fade: short for bursts, long for the lean of the session.
Units sets what the number is. Volume is that side's own size in the symbol's units — the setting where this indicator says something V-Delta does not. Share (%) gives that side's share of the recent aggressive volume instead, as a percentage that compares across symbols.
Reference level draws one dashed line at the level you set, while the band's scale reaches it; at 0, the default, there is none. It only marks a level; it does not set an alert.
Limitations
- It is drawn on heatmap panels only, so only on symbols TapeHawk records.
- It reaches back 24 hours.
- Volume readings do not compare between symbols, and the band's scale fits the values on screen, so two copies — buying and selling — each have their own scale.
- If TapeHawk stops sending values, the line dims and its row in the info bar shows ⚠ The server has stopped sending values for this indicator. What is drawn is the last it sent, dimmed; it fills in again by itself.
- Each copy takes one of the panel's two band places, so buying and selling together fill both — see Over the price, and in bands.
V-Delta
Aggressive buying minus aggressive selling with older trades fading out — who is pressing right now, in a band under the heatmap.
Stop Volume
Size that went through the book in runs across several price levels — the shape stop orders leave — buy side against sell side, fading out, with a mark when a cluster finishes.