VPOC
The volume point of control of every bar — the price that traded the most inside it — with rays from the levels price has not returned to.
The price that traded most inside each candle — where the market accepted price.
- Candles
- 1m, 5m, 15m, 1h
- Footprint
- 1m, 5m, 15m, 1h
- Heatmap
- any range
- Not drawn on
- Renko, Range bars, Line break — This chart type has no time axis, so order-flow indicators cannot be plotted on it
- Needs
- the instrument's price grid — without it the chart shows: “Instrument tick unknown — this indicator needs the exchange price grid”
- Alerts
- no
What it shows
For every bar, a short horizontal mark over the price at the bar's point of control — the price row that traded the most volume inside it. By default the marks are joined into a stepped line: each bar keeps its own level, and a vertical at the bar boundary leads to the next one.
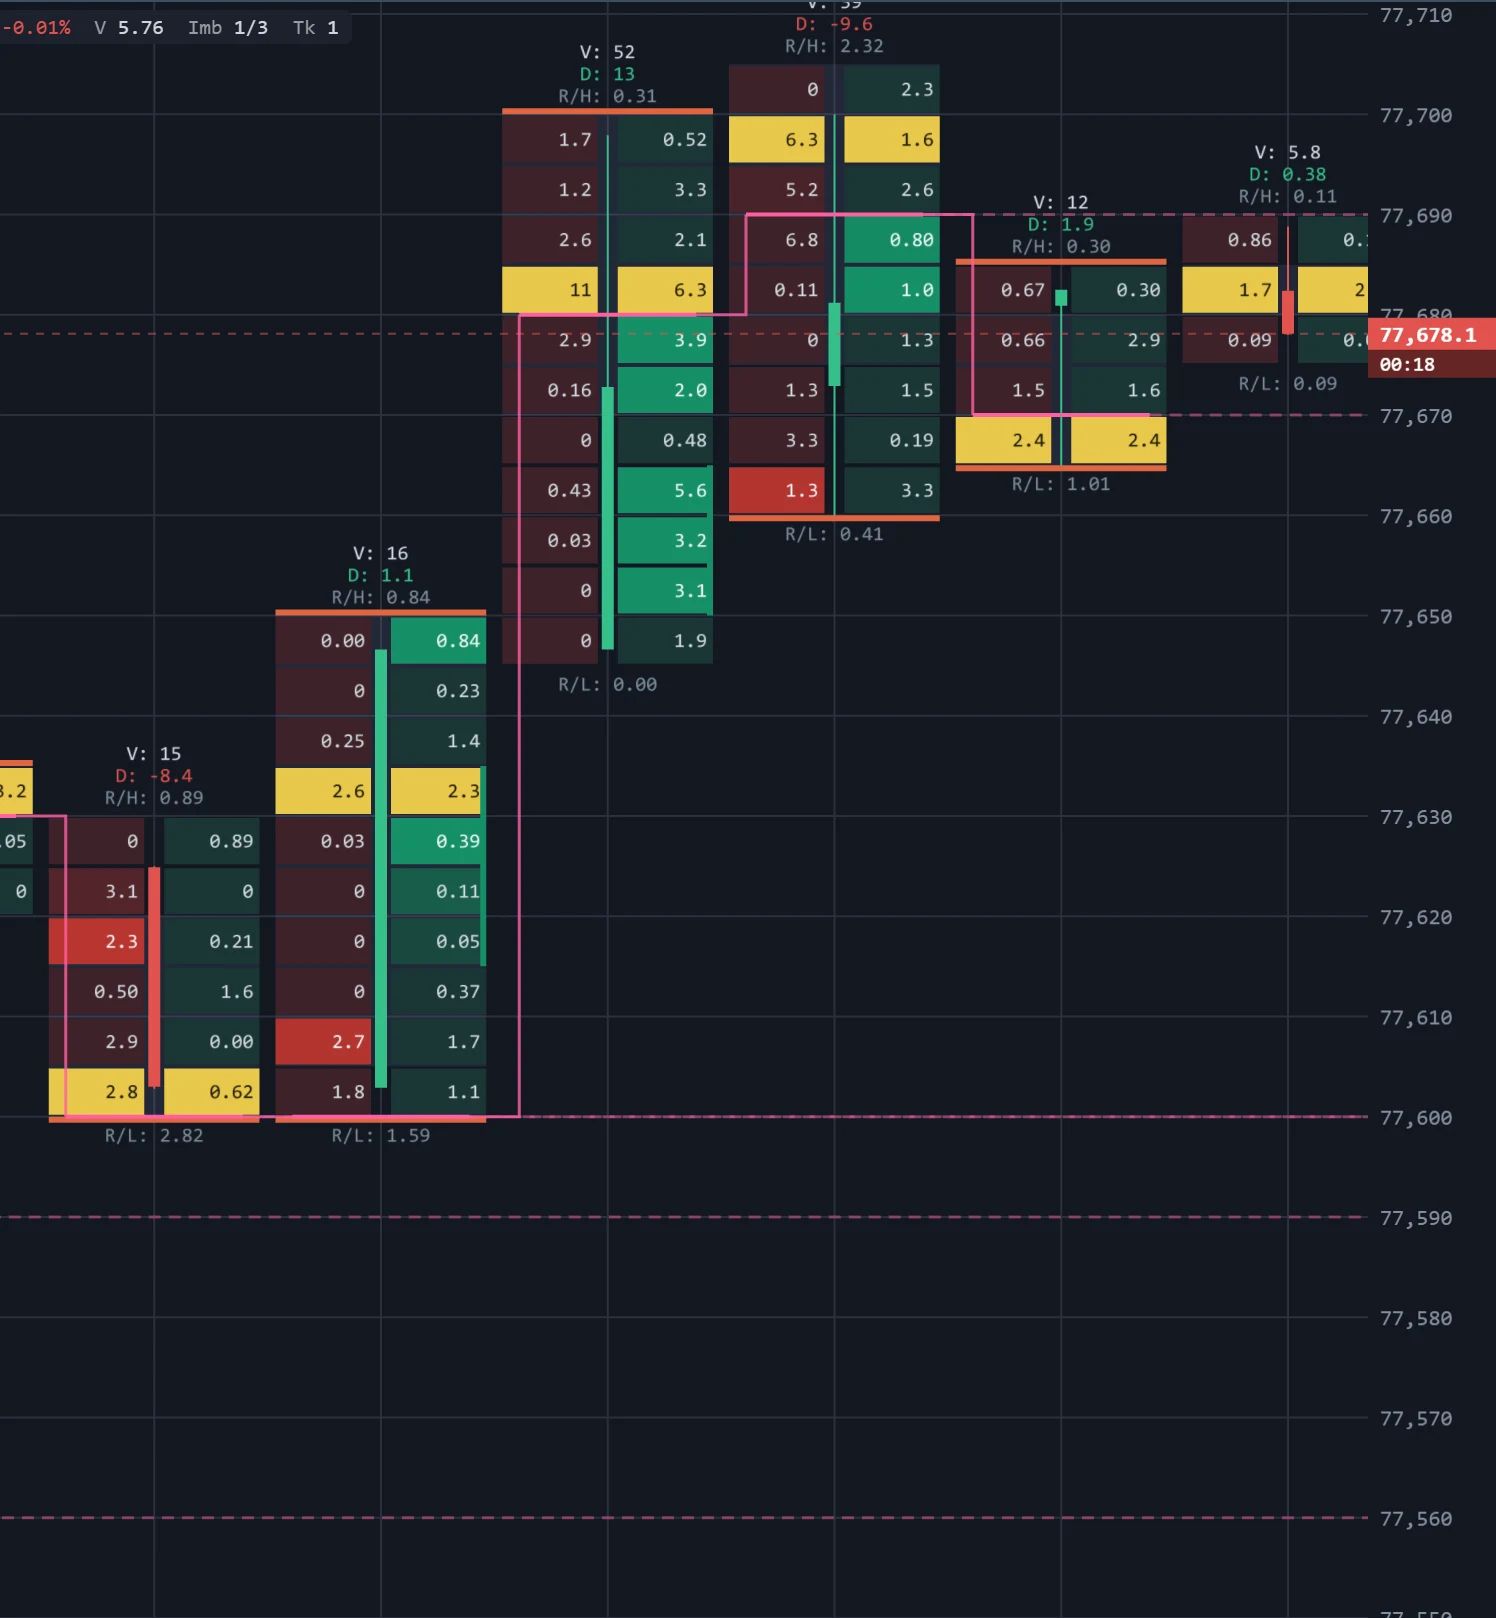
A level that no later bar has traded at again is naked. From each naked level a faint dashed ray runs to the right edge of the chart, so the prices the market has left behind stay in view.
On a heatmap each mark covers one minute of trading.
How to read it
- Acceptance. The point of control is where the bar did most of its business — the price the market accepted. A string of marks at nearly the same level describes a market building value in one place.
- Migration. Points of control stepping up bar after bar mean the busiest trading is moving higher with price; a candle closing up while its point of control sits at its low says the volume was done lower.
- Naked levels are places the market traded heavily and then left without looking back. Price often returns to test them. As soon as a later bar trades at that price again, the level is no longer naked and its ray is gone.
- A footprint panel highlights each bar's POC row in gold as well. VPOC picks its rows with its own price step, so the two agree when the steps match and can differ when they do not.
Parameters
| Setting | Control | What it does |
|---|---|---|
| Price step (ticks) | Number | Range and default are set by TapeHawk; the settings dialog shows them. |
| Join marks | Choice separate marks · stepped line · straight line | How the POC marks are joined. Step keeps each bar at its own level; line cuts across prices that never traded. default: stepped line |
| Naked POC ray | On / off | Extends an old level rightwards until price comes back and touches it. Off leaves one mark per bar. |
| Colour | Colour |
Price step (ticks) groups the exchange's price steps into rows before the busiest row is chosen. Larger rows give a steadier level that jumps less between neighbouring prices, at a coarser price; smaller rows follow the exact busiest price.
Join marks only changes the drawing: separate marks, stepped line (the default) or straight line, which draws diagonals across prices that may never have traded. Naked POC ray turns the rays on or off.
Limitations
- On candles and footprint it draws only at 1m, 5m, 15m and 1h, and not on Renko, range bars or line break. It needs the symbol's price steps; until the panel has them its row in the menu says (no price grid).
- Each bar's mark arrives once the bar has closed, so the newest bar has none.
- It reaches back 24 hours on a symbol TapeHawk records, and about half an hour on a live-only symbol.
- Rays come only from bars on screen: scroll a level's bar off the left edge and its ray goes with it.
- Every level can have a ray, so a large price step on a long stretch of bars can crowd the chart with them; turn Naked POC ray off if they get in the way.
Stop Volume
Size that went through the book in runs across several price levels — the shape stop orders leave — buy side against sell side, fading out, with a mark when a cluster finishes.
Volume Profile
How much traded at each price over the current session, as a horizontal histogram split into bid and ask, with the point of control and the value area.