Parabolic SAR
A trailing stop level drawn as marks below price in an uptrend and above it in a downtrend, flipping sides when price reaches it.
Dots that run below then above price, flipping when the trend does — a trailing stop level.
- Candles
- 1m, 3m, 5m, 15m, 30m, 1h, 2h, 4h, 6h, 12h, 1d, 1w, 1M
- Footprint
- 1m, 5m, 15m, 1h
- Alerts
- no
What it shows
A stop-and-reverse level, drawn as a short horizontal mark at that level on every candle. In an uptrend the marks sit below the candles and rise towards price; in a downtrend they sit above and fall towards it. When price reaches the mark, the trend is treated as over: the marks jump to the other side of price, starting from the extreme the previous trend reached, and begin closing in again.
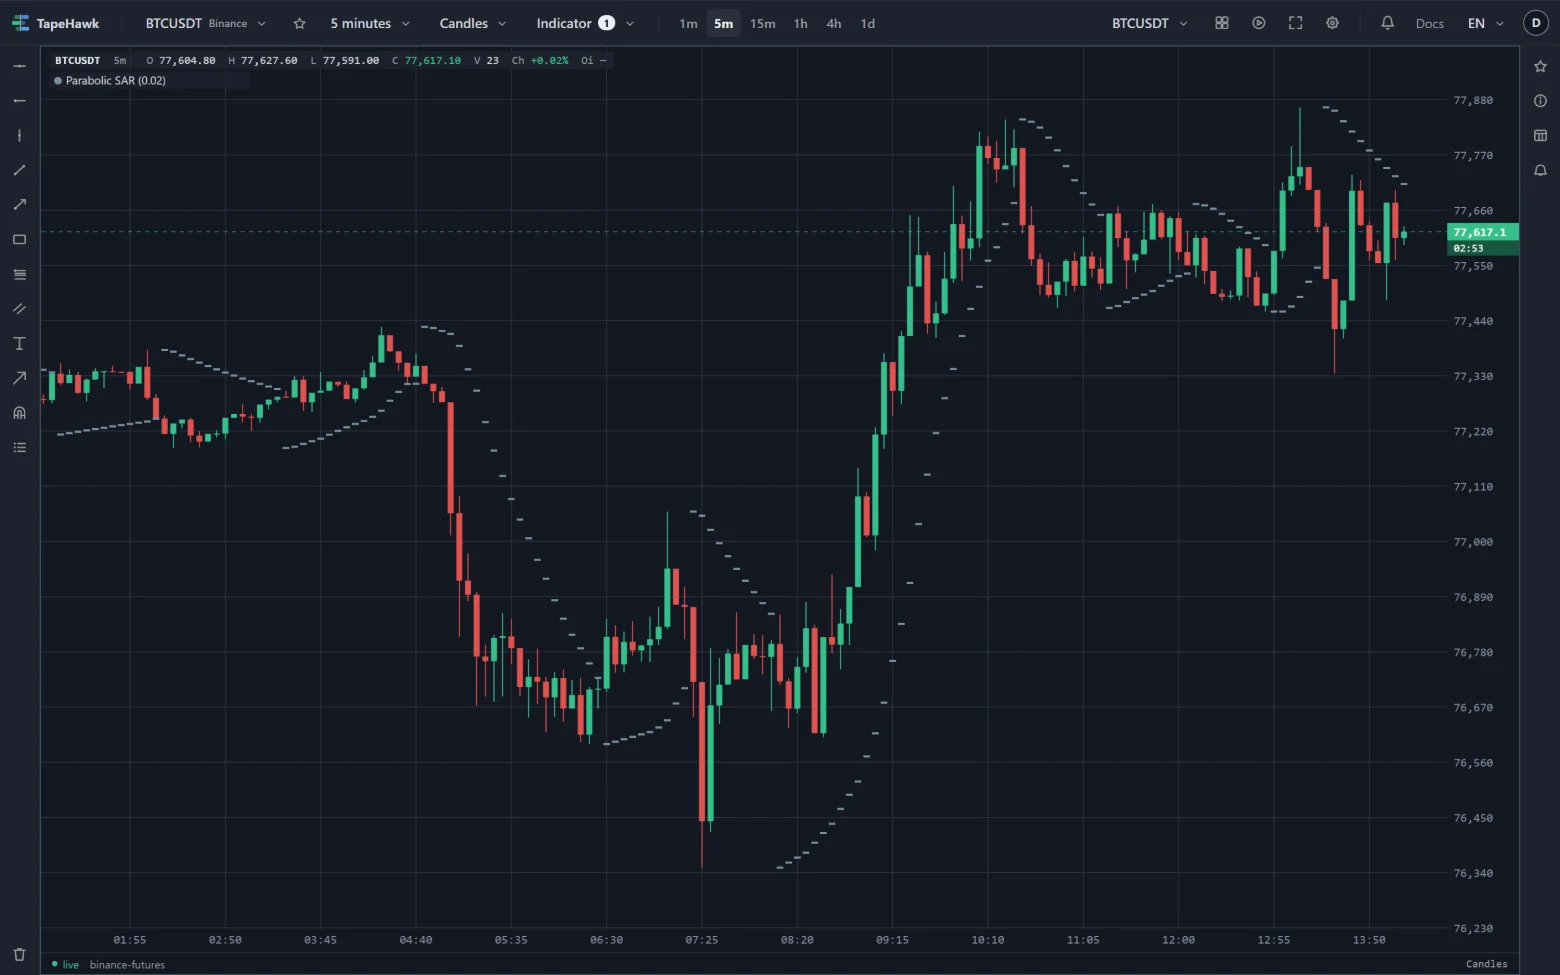
Each time price makes a new extreme in the trend, the marks speed up. A trend that keeps extending therefore pulls the marks in faster and faster — the "parabolic" in the name. A mark is never placed inside the range of the two candles before it.
The info bar names it by its acceleration factor — Parabolic SAR (0.02).
How to read it
- Side. Marks below the candles mean the indicator reads an uptrend; above, a downtrend.
- A flip. Price reaching the marks and the marks moving to the other side is the signal: the trend it was following has ended, and the new trend starts at once.
- A trailing stop. Many traders use the current mark as their stop in the direction of the trend, moving it candle by candle.
- Sideways markets. When price moves back and forth, the marks flip often and each flip comes after the move. The indicator works best in trending stretches.
Parameters
| Setting | Control | What it does |
|---|---|---|
| Acceleration factor | Number | How fast the dots catch up after each new extreme. Higher tracks closer and stops out sooner. 0.001–0.1 · default 0.02 |
| Max acceleration | Number | Ceiling for the acceleration factor. Stops the dots tightening forever in a long trend. 0.05–0.5 · default 0.2 |
| Join marks | Choice separate marks · stepped line · straight line | How the reversal dots are joined. Separate is truest — joining draws a staircase through levels the stop never sat at. default: separate marks |
| Colour | Colour |
Acceleration factor is both the starting speed and the amount the speed rises with every new extreme; Max acceleration caps it. A higher factor keeps the marks tight to price and flips sooner; a lower one gives a trend more room.
Join marks only changes how the marks look. separate marks draws the level where it actually was on each candle. stepped line and straight line connect the marks, which reads more easily but draws lines through prices the stop never sat at — including across each flip.
Limitations
- It is computed from the candles loaded on the panel and starts from the first two of them, so the marks near the start of the loaded history depend on where that history begins.
- It always shows a trend, even in a market that has none, so it flips often in ranges.
- The newest candle is still trading: its mark, and whether it flips, can change until that candle closes.
- It follows the candle shape: on Heikin Ashi it uses the real highs, lows and closes, and on Renko, range bars and line break those of the bricks and bars drawn — see Where an indicator can be drawn.
- It prints no value: read the marks against the price axis.
- It takes no alert. Its Alert tab says it draws no signal; for a price level, set a price alert.