Indicators
Adding, configuring, hiding and removing indicators, where each kind is drawn, the limits on one panel, and what the notes beside an indicator mean.
An indicator is computed from a panel's own data and drawn on that panel. Each panel keeps its own list, so two panels can show the same symbol with different indicators. This section has a page for every indicator the chart offers, in the order the indicator menu lists them.
The indicator menu
Indicator in the toolbar opens the menu for the selected panel (on a phone it is a section of the menu). The number beside the name counts the indicators switched on for the panel. The menu has three sections:
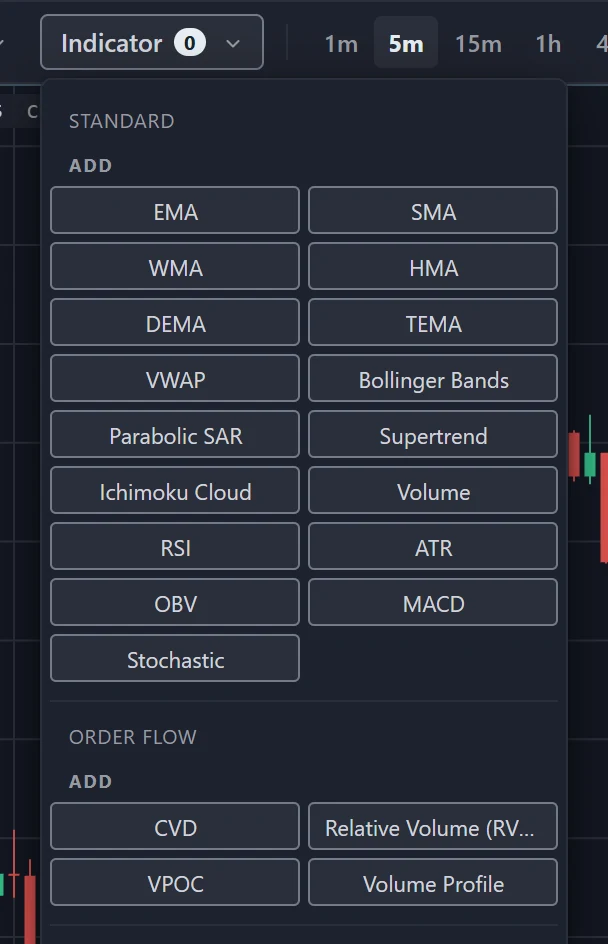
- Standard — moving averages, bands, oscillators and volume, computed from the bars. They draw on candles and footprint panels; on a heatmap the section only says Needs a candle or footprint panel.
- Order flow — indicators that read the trades and the order book TapeHawk records. A heatmap panel offers all of them except S/R Zones and Absorption Zones, which only a footprint panel draws. A candles panel offers CVD, Relative Volume (RVOL), VPOC and Volume Profile; a footprint panel offers those four and S/R Zones and Absorption Zones.
- My indicators — with a confirmed account, the indicators you wrote yourself. A script that runs on trades or the order book is offered on heatmap panels only; the other panels name it with a note — see Your indicator on a chart. The menu then ends with Write an indicator…, which opens the script editor.
Each indicator on the panel has a row. Click its name to switch it on or off — a tick means it is on. The gear opens its settings and ✕ removes it.
Under the rows, Add lists every indicator of that section. On a computer, point at
a name to read what the indicator shows. You can add the same indicator more than once — an EMA of 20 and an
EMA of 200, say — and each copy keeps its own settings. A new copy starts with the default colour, so give it another one to tell
the lines apart. The rows name copies by their numbers:
EMA (20), EMA (200). Order-flow indicators that mark events on the heatmap, and the trade bubbles, can be
on a panel only once, so they leave the list once added.
Adding and removing
- Adding an indicator draws it with its default settings and opens its settings dialog, if it has any settings.
- Switching off hides an indicator and keeps it on the panel with its settings, so switching it back on restores it as it was. The eye on its row in the panel's info bar does the same, outside the phone layout — see Panels and layouts.
- Removing takes it off the panel for good. If you changed any of its settings, the chart asks you to confirm first, because its colour and settings go with it. The trade bubbles of a heatmap cannot be removed, only hidden.
An indicator the panel holds but cannot draw at all — one added on a candles panel that is now a heatmap, for example — keeps a row marked (not drawn here) with a ✕, and draws again if the panel changes back.
What you set up is saved with the panel in your layout. Signed out, it lasts until the page reloads.
Settings
The settings dialog is titled with the indicator's name and main numbers, and has two tabs.
Parameters lists the indicator's settings. Each page in this section has the same list in a table, with the ranges and defaults the dialog shows. Changes reach the chart as you make them:
- a number when you press Enter or move to another field;
- a colour when you leave the colour field;
- a choice or a switch at once.
There is no cancel. Done, Esc or a click outside the dialog closes it.
On a Standard indicator, a number outside the range shown under its field is set to the nearest end of the range. The chart carries the calculation for the default numbers; most other numbers are fetched the first time you use them, so after you change one the line can be missing for a moment before it is drawn again. If TapeHawk could not be reached, the chart asks again by itself a little later. When TapeHawk has been updated while the page was open, a message asks you to reload instead.
Most order-flow indicators are calculated by TapeHawk rather than in your browser. Their settings are read from TapeHawk when the dialog opens, and until they arrive the tab says
Loading settings…
Alert is where an indicator that draws a signal — a detected event, a zone — offers an alert for each signal it draws. For every other indicator the tab says it draws no signal; a price level takes a price alert instead. Each indicator page's header states whether an alert on it can reach you — the footprint zones alert once a bar closes, on the panel's timeframe — and alerts need a confirmed account; see Signal alerts.
Over the price, and in bands
Among the Standard indicators, these draw over the price: the moving averages, VWAP, Bollinger Bands, Parabolic SAR, Supertrend and Ichimoku Cloud. They print no numbers — read them against the price axis. Volume draws as columns along the foot of the price plot.
Indicators on a different scale from price draw in a band under the price plot: RSI, ATR, OBV, MACD, Stochastic, and several order-flow indicators.
- A band has its own scale along its right edge, and its name in the top-left corner. Point at a bar and the band's values at that bar follow the name.
- RSI and Stochastic keep a fixed 0–100 scale. The other bands fit their scale to the bars on screen, so the same value can sit higher or lower in the band after you scroll or zoom.
- Drag a band's top edge to change its height. The band's Height (%) setting holds the same number.
- A panel holds two bands at most. A hidden band keeps its place, so remove one to add another. At two, the band indicators in Add are greyed out.
- When a panel is too short for every band it holds, the bands that do not fit are left out and the chart says Not enough room — resize or turn off a band. They come back when the panel has room. In the phone layout a panel shows one band.
Marks on the heatmap
Several order-flow indicators mark events on the heatmap rather than drawing a line: Volume Spikes, Absorptions, Sweeps, Stop Runs, Liquidity Changes and Market Volume Imbalance. The bands of Stop Volume and Book Imbalance mark their signals on the heatmap too. What they have in common:
- Where. A mark sits at the price and the moment the event refers to. Many events are only known once they are over — a run that has stopped, a line that has come back from its peak — so a mark can appear a little after the moment it is placed at.
- Shape and colour. The shape, with the name on its plate, says which signal the mark is — a few shapes are shared, such as the triangle of Volume Spikes and of Book Imbalance — and the colour, with the direction a pointed shape faces, says which side. Each indicator's page lists its shapes.
- Figures. Beside a mark, a small plate prints the indicator's short name and the event's figure — a size, or a reading — where there is room; a crowded mark keeps its shape and drops the plate.
- Tooltip. Point at a mark and the heatmap's tooltip adds the signal's name as the indicator calls it, its side, Figure — the same figure the plate prints — and the time it refers to.
- Held marks. An indicator with Hold back marks the flow contradicts can hold back a mark the prevailing order flow disagrees with, and Market Volume Imbalance holds back repeats with its pullback rule. A held mark is drawn as an outline, with no plate and no alert, so you can see what the rule removes. Hide held marks hides the outlines; nothing is deleted.
- Density. Max marks / minute caps how many marks of each signal an indicator draws in any clock minute. An alert on the signal is capped the same way at the default figure: changing it on the panel changes only the drawing. Liquidity Changes has a fixed cap instead.
- History. TapeHawk detects most of these on its servers from the recorded trades, so their marks fill the heatmap's history as far as 24 hours back. Liquidity Changes and Book Imbalance read the live order book in your browser instead: they start when the panel opens, and what they found is gone when the page reloads.
- Thresholds are per symbol. Several detectors fire on an absolute amount of money traded, and their defaults are set for BTCUSDT. On a smaller symbol they may hardly ever fire; on a busier one, often. Each page says which settings carry that amount.
Where an indicator can be drawn
The header at the top of each indicator page lists the panel kinds and timeframes it draws on. When a panel cannot draw an indicator right now, the indicator stays on the panel, its row in the menu carries a short note, and it draws again as soon as the panel can. Point at the note for the full sentence.
| Note | Why | What brings it back |
|---|---|---|
| (unsupported timeframe) | Order-flow data comes in 1m, 5m, 15m and 1h bars. | One of those timeframes. |
| (no time axis) | Renko, range bars and line break have no time axis. Order-flow indicators need one, and so does an indicator drawn ahead of the last bar. | A time-based candle shape. |
| (no price grid) | The indicator is built on the exchange's price steps, and the panel does not know them for this symbol. | Nothing you set: the note clears if the panel learns them. |
Standard indicators follow the candle shape you pick. On Heikin Ashi they are computed from the real candles, not the smoothed ones. On Renko, range bars and line break they are computed from the bricks and bars the panel builds from its history. Candle shapes explains what that does to volume.
When an indicator is not drawing
A ⚠ on an indicator's row in the panel's info bar means it is not drawing as it should. Point at it for the reason:
- The server has stopped sending values for this indicator. What is drawn is the last it sent, dimmed; it fills in again by itself.
- This stretch is older than the recorded tape, so there is nothing to draw for it. Move to a more recent span.
- Too many candles on screen for this indicator to read. Scroll forward, or zoom in, and it draws again.
- This indicator's script no longer compiles, so it cannot be drawn. Open the editor to fix it.
- Cannot be drawn — see the console — the indicator's calculation or drawing failed, and the reason is written to the browser's developer console.
With the rows collapsed, one ⚠ beside the dots stands for all of them. The phone layout has no info bar rows for indicators, so there only a band's own note, below, says anything.
A band that has nothing to draw says why in the middle of the band: why it cannot be drawn on this panel, that it failed, that too many candles are on screen, or No data for this band yet.
Limits
| On one panel | Limit | When you reach it |
|---|---|---|
| Indicators | 5, counting hidden ones and ones kept for another panel kind. A layout saved with more keeps them all, but only the first 5 in the order they were added are drawn; removing one brings the next in | The chart says the indicator limit is reached, and the legend says how many saved indicators are hidden |
| Bands | 2, counting hidden ones | The band indicators in Add are greyed out |
| Event markers and trade bubbles | One of each | They leave Add |