Indicators
VWAP
The volume-weighted average price since the anchor — the average price paid, with each candle weighted by the volume it traded.
Volume-weighted average price since the anchor — where most of the volume actually traded.
- Candles
- 1m, 3m, 5m, 15m, 30m, 1h, 2h, 4h, 6h, 12h, 1d, 1w, 1M
- Footprint
- 1m, 5m, 15m, 1h
- Alerts
- no
What it shows
The average price traded since the anchor, weighted by volume, drawn over the price. Each candle adds its typical price — the average of its high, low and close — counted as many times over as the volume it traded. A candle with heavy volume pulls the line towards its price; a quiet candle barely moves it.
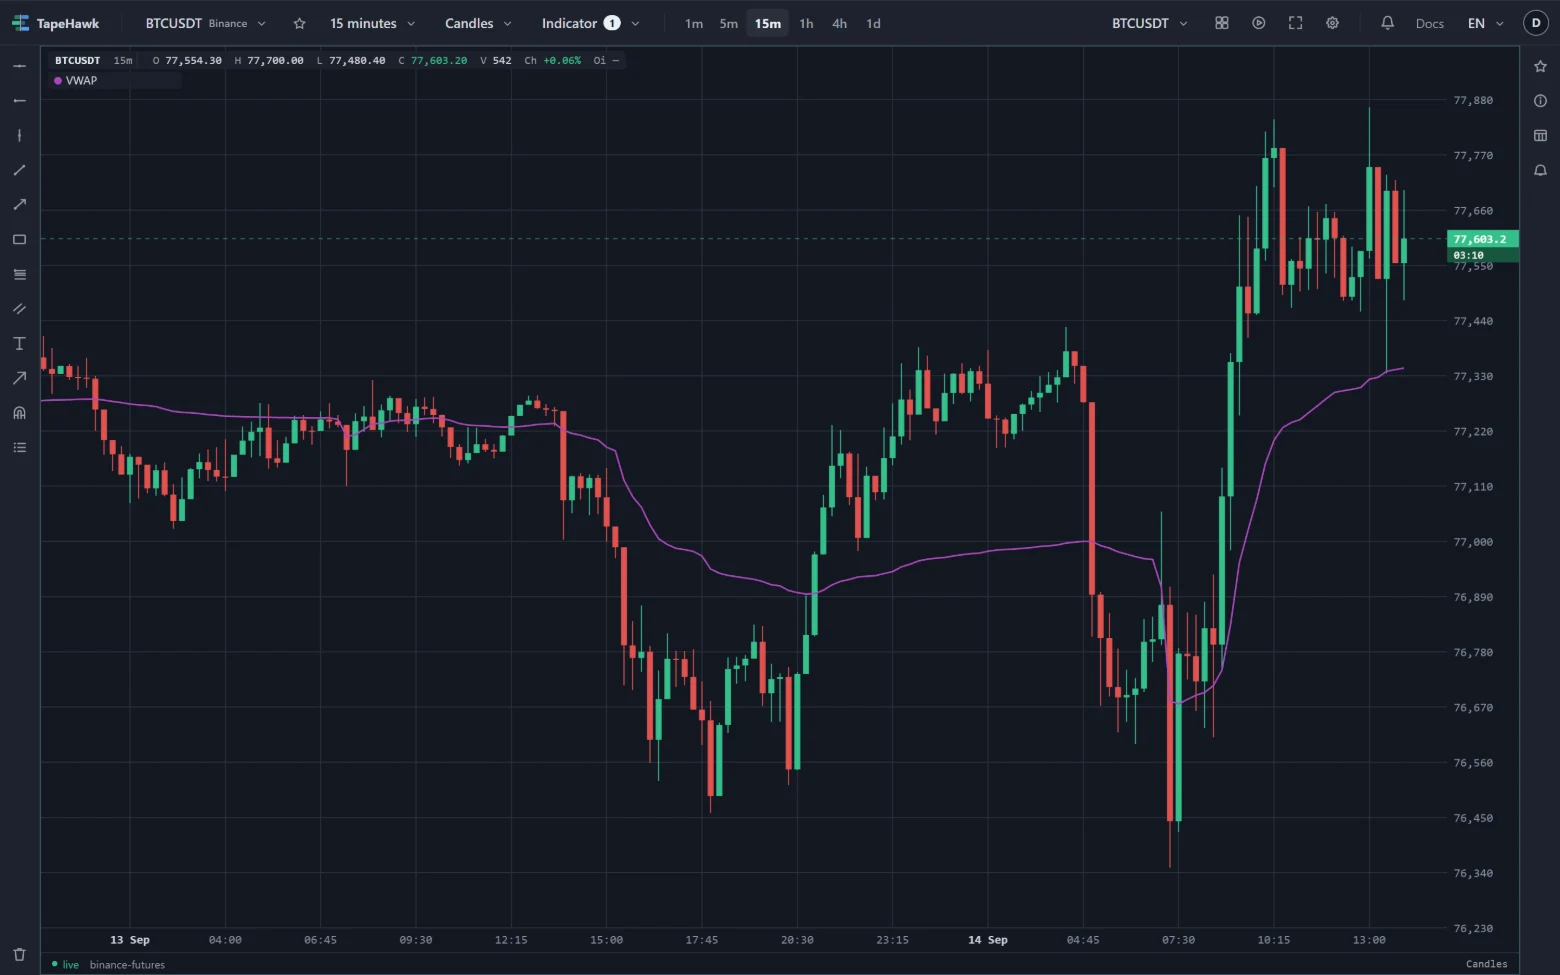
With the daily anchor the line starts again at 00:00 UTC, so each day begins at the first candle's typical price and settles as the day's volume builds up.
How to read it
- Price above or below. Price above VWAP means the market is trading above the average price paid so far in the day — buyers have been paying up. Below it, the reverse.
- A reference level. Many traders judge their fills against VWAP, so price often returns to it in a quiet market and reacts when it gets there.
- Trend days. On a strong trending day price can stay on one side of VWAP for hours, and the line slopes steadily after it. On a range day it goes flat and price crosses it again and again.
- Early in the day the line moves easily, because little volume has built up behind it. It carries more weight later in the day.
Parameters
| Setting | Control | What it does |
|---|---|---|
| Anchor | Choice Daily (UTC) · From first bar loaded | Where VWAP restarts. By day is the standard; from the loaded data moves with whatever history was fetched. default: Daily (UTC) |
| Colour | Colour |
Anchor decides where the average starts:
- Daily (UTC) starts again at 00:00 UTC every day, whatever timezone the chart axis shows. This is the usual VWAP.
- From first bar loaded runs from the oldest candle loaded on the panel, without restarting. It gives an average over a longer stretch, but that stretch is set by how much history happens to be loaded.
Limitations
- On the 1d timeframe and longer, every candle starts a new day, so a daily VWAP restarts on each candle and only marks that candle's typical price. Use a shorter timeframe, or From first bar loaded.
- From first bar loaded moves when older history loads — scrolling back far enough to fetch older candles gives the line a different starting point, and the whole line changes.
- It is built from candles, not from individual trades: within a candle, all of its volume counts at the candle's typical price.
- The newest candle is still trading, so the last point of the line moves until that candle closes.
- On Renko, range bars and line break it is computed from the bricks and bars drawn, whose volume is an estimate or partial on two of the three — see Candle shapes.
- It prints no value: read it against the price axis.
- It takes no alert. Its Alert tab says it draws no signal; for a price level, set a price alert.