Bollinger Bands
A moving average with an upper and a lower band set by recent volatility — wide when the market swings, narrow when it coils.
A moving average with two bands that widen with volatility. Narrow bands mean the market is coiling.
- Candles
- 1m, 3m, 5m, 15m, 30m, 1h, 2h, 4h, 6h, 12h, 1d, 1w, 1M
- Footprint
- 1m, 5m, 15m, 1h
- Alerts
- no
What it shows
Three lines over the price. The middle band is a simple moving average of the closes. The upper and lower bands sit above and below it by a multiple of the closes' standard deviation over the same length — a measure of how far the closes have been spreading from their average. The space between the outer bands is shaded.
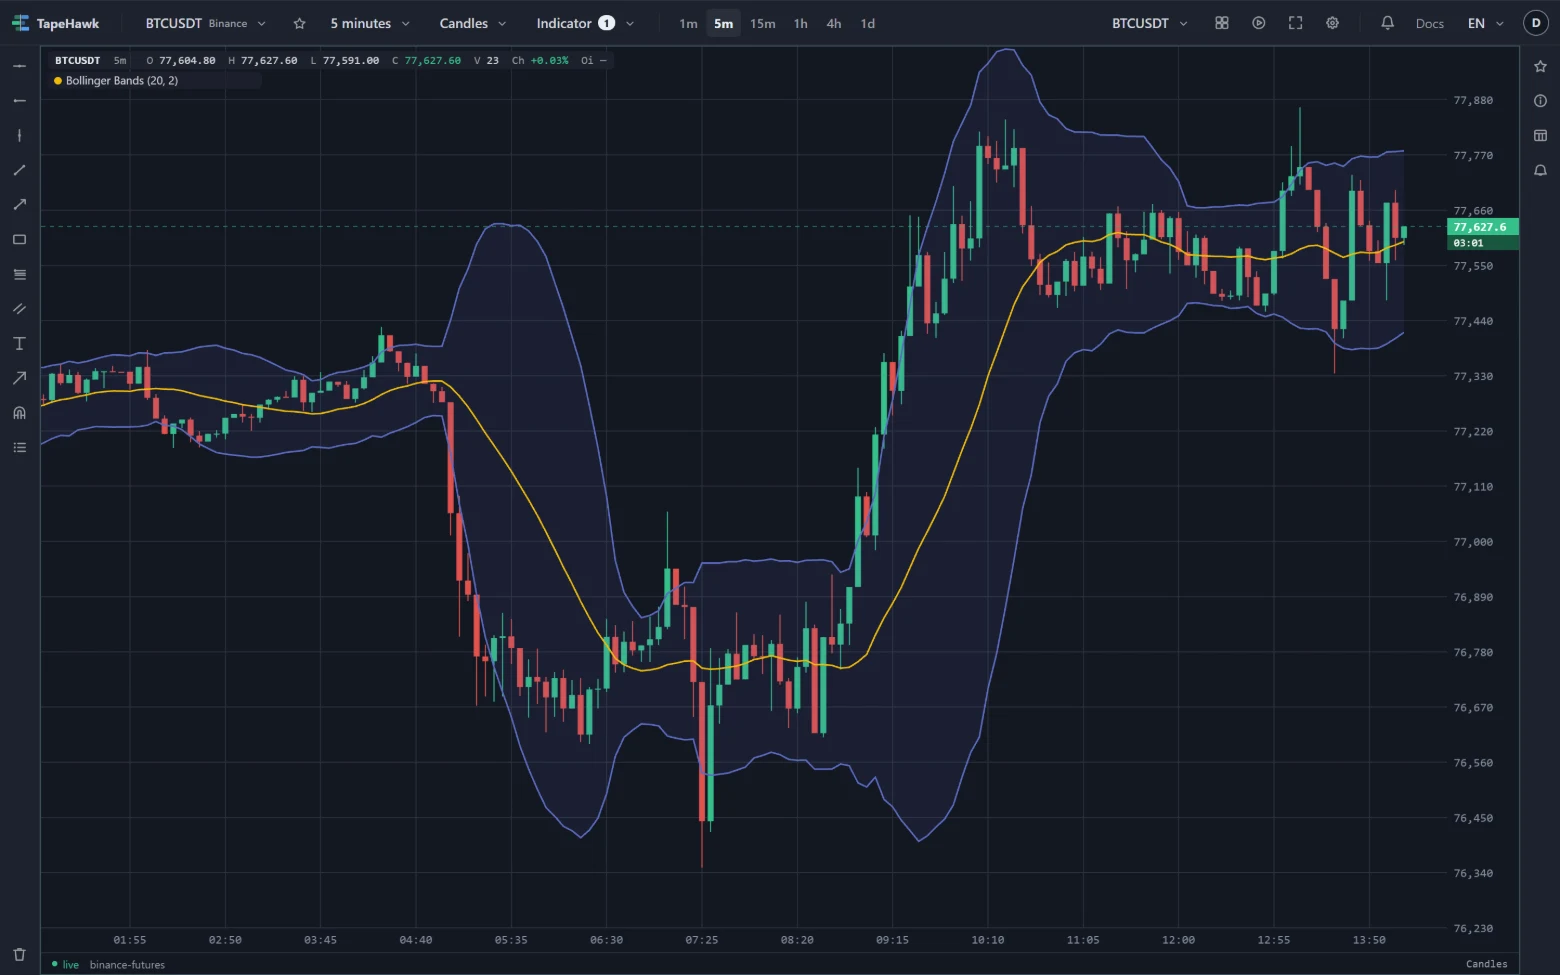
When price swings widely, the standard deviation grows and the bands move apart. When the market goes quiet, they close in.
The info bar names it by its length and multiplier — Bollinger Bands (20, 2).
How to read it
- Width. Narrow bands mean a quiet, coiling market; such stretches are often followed by a larger move. Wide bands mean volatility is already high.
- Touching a band. With the default multiplier most closes stay inside the bands, so a close outside one is unusual. On its own that is not a signal to fade the move: in a strong trend price can walk along the upper or lower band for many candles.
- Middle band. In a range, price tends to swing between the outer bands and cross the middle band on the way. In a trend, pullbacks often stop near the middle band.
- Breakouts. A close outside a band just after a narrow stretch is the classic sign that the quiet period has ended in that direction.
Parameters
| Setting | Control | What it does |
|---|---|---|
| Length | Number | Both the midline's period and the window the outer bands' standard deviation is measured over. 1–1000 · default 20 |
| Std dev multiplier | Number | Band width, in standard deviations. 2 covers roughly 95% of candles. 0.1–5 · default 2 |
| Middle band colour | Colour | |
| Outer band colour | Colour | |
| Fill opacity (%) | Number | Opacity of the shading between the lines. Set 0 to turn the fill off and keep the edges. 0–40 · default 10 |
Length sets both the moving average and the window the spread is measured over. Std dev multiplier sets how far out the bands sit: a smaller number puts them closer to price, so price touches them more often; a larger one keeps them for bigger moves. Fill opacity (%) at 0 removes the shading and leaves the outer lines.
Limitations
- It is computed from the candles loaded on the panel. The first candles of that history have no bands until there are enough to fill the length.
- The bands measure how far closes spread, not highs and lows: a candle with long wicks and a quiet close widens them less than its range suggests.
- The newest candle's close is the live price, so the last points of all three lines move until that candle closes.
- It follows the candle shape: on Heikin Ashi it uses the real closes, and on Renko, range bars and line break the closes of the bricks and bars drawn — see Where an indicator can be drawn.
- It prints no values: read the bands against the price axis.
- It takes no alert. Its Alert tab says it draws no signal; for a price level, set a price alert.