Relative Volume (RVOL)
How much a bar traded against how much the bars before it usually traded, as a multiple, in a band under the chart.
This bar’s traded volume against a baseline of the bars before it. 3 means three times the usual. A BAR-LEVEL reading: on candles and footprint a bar is the panel timeframe, and on the heat panel it is one wall-clock column — so the same setting reads a different span there than an alert would.
- Candles
- 1m, 5m, 15m, 1h
- Footprint
- 1m, 5m, 15m, 1h
- Heatmap
- any range
- Not drawn on
- Renko, Range bars, Line break — This chart type has no time axis, so order-flow indicators cannot be plotted on it
- Alerts
- no
What it shows
A line in a band under the chart: each bar's traded volume as a multiple of a baseline of the bars before it. At one, the bar traded as much as usual; above one, more; below one, less.
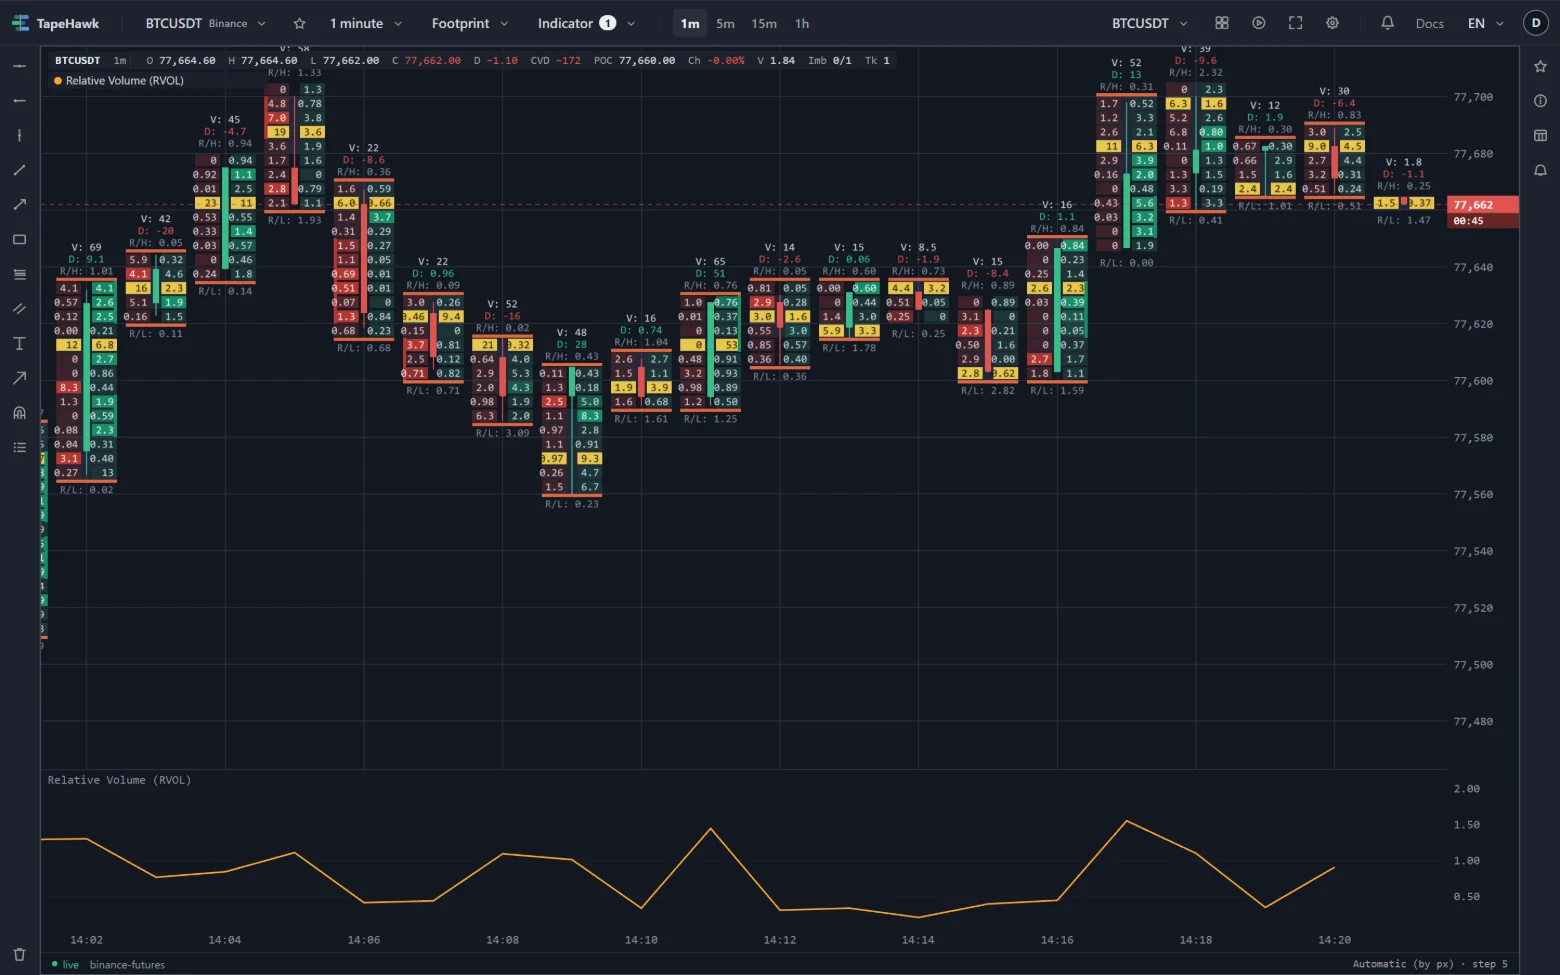
The baseline describes the bars before the one being judged, never the bar itself — so a sudden burst is compared with the market that came before it. A bar with no trades at all gets no value.
On a candles or footprint panel a bar is the panel's timeframe. On a heatmap each value covers one minute and is
held flat across the narrower heatmap columns; the band's name shows 1m.
How to read it
- Spikes stand out as peaks well above the rest of the line: minutes where participation jumped. Look at where they happen — at a level, after a long quiet stretch, at the end of a trend.
- Quiet stretches with the line below one often come before a move, as a market waits.
- Confirmation. A breakout bar with a high reading has participation behind it; the same breakout on an ordinary reading has less.
- Direction is not in it. RVOL says how loud a bar was, not which side was loud. Pair it with CVD for who was aggressive.
Parameters
| Setting | Control | What it does |
|---|---|---|
| Length | Number | Range and default are set by TapeHawk; the settings dialog shows them. |
| Reference level | Number | Draws a dashed line at plus and minus this value. It marks a level to watch; it does not arm an alert — that lives on the alert rule. 0 hides it. 0–50 · default 0 |
| Height (%) | Number | Height of the band, as a percentage of the panel. Dragging the band's edge changes it too. 8–50 · default 18 |
| Colour | Colour |
Length sets how far back the baseline reaches, in bars: a longer baseline changes slowly and makes a spike stand out against a steadier norm; a shorter one adapts quickly, so a busy stretch soon reads as ordinary.
Reference level draws a dashed line across the band at the multiple you set, to mark a level you care about; it shows while the band's scale reaches that level, and not at all at 0, the default. It does nothing else — it does not set an alert.
Limitations
- On candles and footprint it draws only at 1m, 5m, 15m and 1h, and not on Renko, range bars or line break.
- The narrowest bar is a minute, so a burst of a few seconds is averaged with the quiet seconds around it and reads smaller than it felt. For bursts, V-Delta on a heatmap follows the flow trade by trade.
- Each bar's value arrives once the bar has closed, so the line stops at the last closed bar.
- The first bars have no value until the baseline has enough bars behind it.
- It reaches back 24 hours on a symbol TapeHawk records, and about half an hour on a live-only symbol.
- The band's scale fits the values on screen.
- It takes one of the panel's two band places — see Over the price, and in bands.