Supertrend
A trend-following stop line set a multiple of ATR away from price — below price in an uptrend, above it in a downtrend.
A trend-following stop line built from ATR. When price crosses it, the line flips sides.
- Candles
- 1m, 3m, 5m, 15m, 30m, 1h, 2h, 4h, 6h, 12h, 1d, 1w, 1M
- Footprint
- 1m, 5m, 15m, 1h
- Alerts
- no
What it shows
A stop line over the price that follows the trend. It is placed a multiple of the average true range away from the middle of each candle — below price while the trend is up, drawn in the uptrend colour, and above price while it is down, in the downtrend colour.
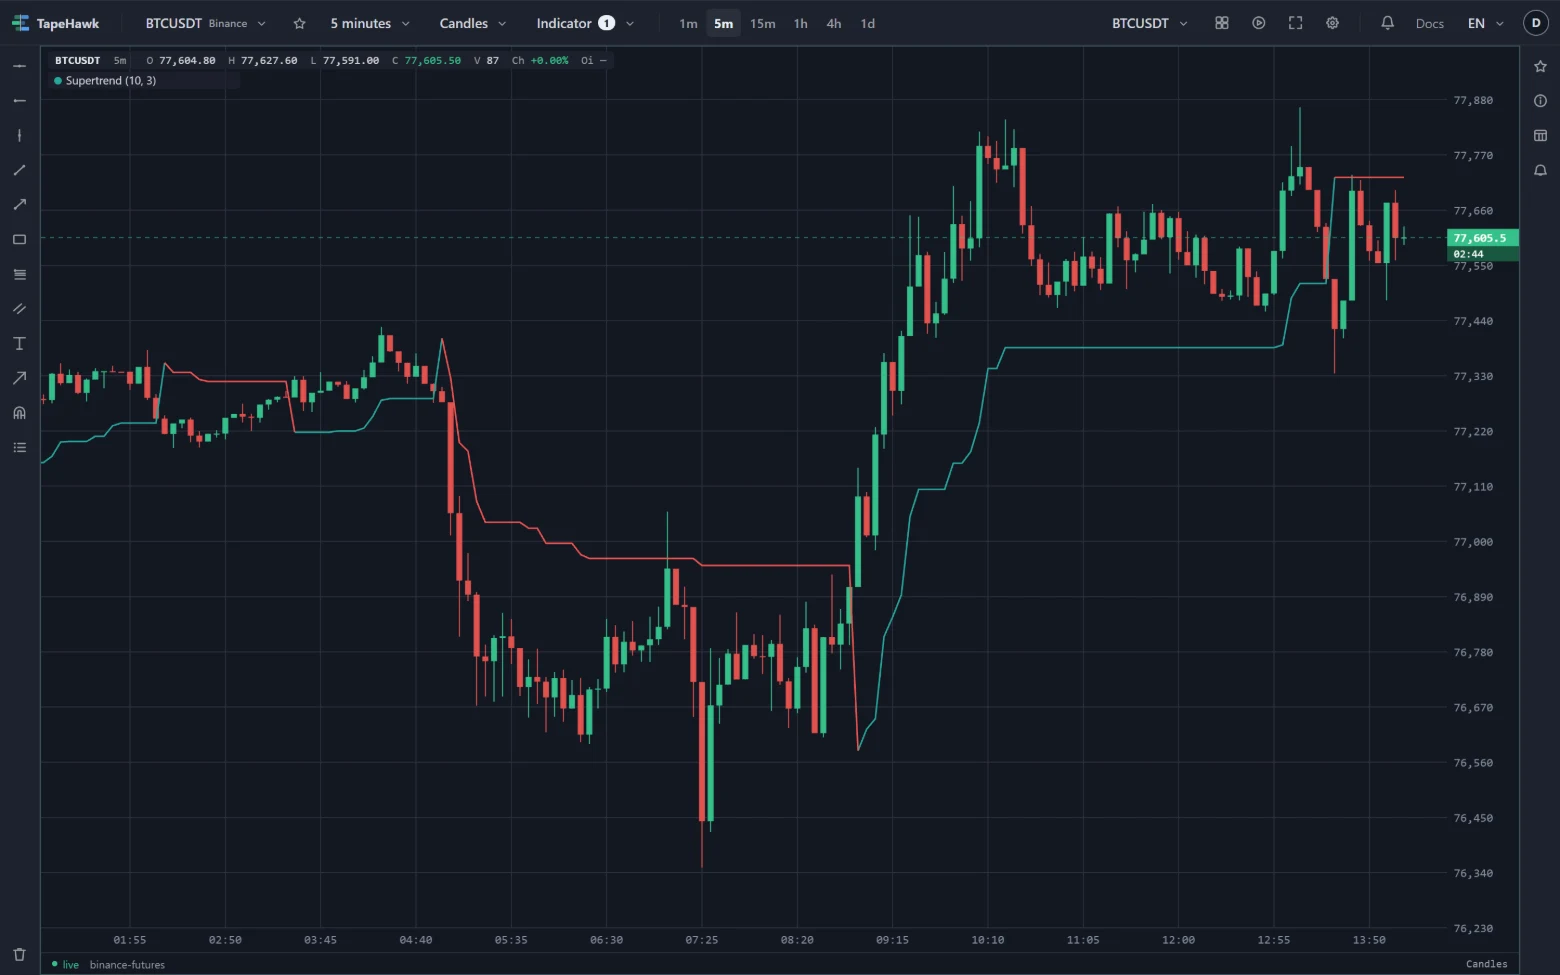
The line only moves in the direction of the trend: in an uptrend it can rise but never fall, and in a downtrend it can fall but never rise. When a candle closes through it, the trend flips, and the line crosses to the other side of price and carries on in the other colour.
The info bar names it by its length and multiplier — Supertrend (10, 3).
How to read it
- Colour and side. The line below price in the uptrend colour means the indicator reads an uptrend; above price in the downtrend colour, a downtrend.
- A flip — a close through the line — is its signal that the trend has changed.
- A trailing stop. Many traders keep their stop at the line and move it as the line moves.
- Flat stretches. The line stays flat while price moves sideways or pulls back towards it, and moves again when price pushes on in the direction of the trend.
Parameters
| Setting | Control | What it does |
|---|---|---|
| Length | Number | The ATR period the stop distance is measured from — not a price averaging period. 1–100 · default 10 |
| ATR multiplier | Number | Distance from price to the stop line, in ATR multiples. Larger flips less often but later. 0.5–10 · default 3 |
| Uptrend colour | Colour | |
| Downtrend colour | Colour |
Length is the period of the average true range the distance is measured from. It is not a price average: a longer length makes the distance steadier, not the line slower. ATR multiplier sets the distance. A larger multiplier keeps the line further from price, so it flips less often and later; a smaller one flips sooner and more often.
Limitations
- It is computed from the candles loaded on the panel. The first candles of that history have no line until there are enough for the length, and the line then starts on the downtrend side until the first close above it. The distance also depends a little on where the loaded history begins, and settles after a few lengths.
- It flips on closes, so the newest candle can cross the line and cross back before it closes; the flip is only settled when that candle closes.
- In a sideways market it flips back and forth, each time after the move.
- It follows the candle shape: on Heikin Ashi it uses the real candles, and on Renko, range bars and line break the bricks and bars drawn — see Where an indicator can be drawn.
- It prints no value: read the line against the price axis.
- It takes no alert. Its Alert tab says it draws no signal; for a price level, set a price alert.
Parabolic SAR
A trailing stop level drawn as marks below price in an uptrend and above it in a downtrend, flipping sides when price reaches it.
Ichimoku Cloud
The Japanese five-line system — a fast and a slow line, a cloud projected ahead of price, and a lagging line — for trend, momentum and support at a glance.