Stop Volume Profile
Where stops went off, by price — a horizontal histogram of the size that went through the book in runs across several price levels, on a heatmap.
Where stops went off, by price. Only size that belonged to a run through several price levels in one motion is counted, so this is far sparser than the session profile — and its window is the panel's own print log, not an anchored session.
- Heatmap
- any range
- Alerts
- no
What it shows
A horizontal histogram on a heatmap, built like Volume Profile but counting only size that went off as stops. The exchange does not say which trades were stop orders, so the indicator looks for the shape a stop cascade leaves: one aggressive run that pushed through several price levels in a single motion, without a pause. Only the size of such runs is added to the price rows, split into selling at the bid and buying at the ask.
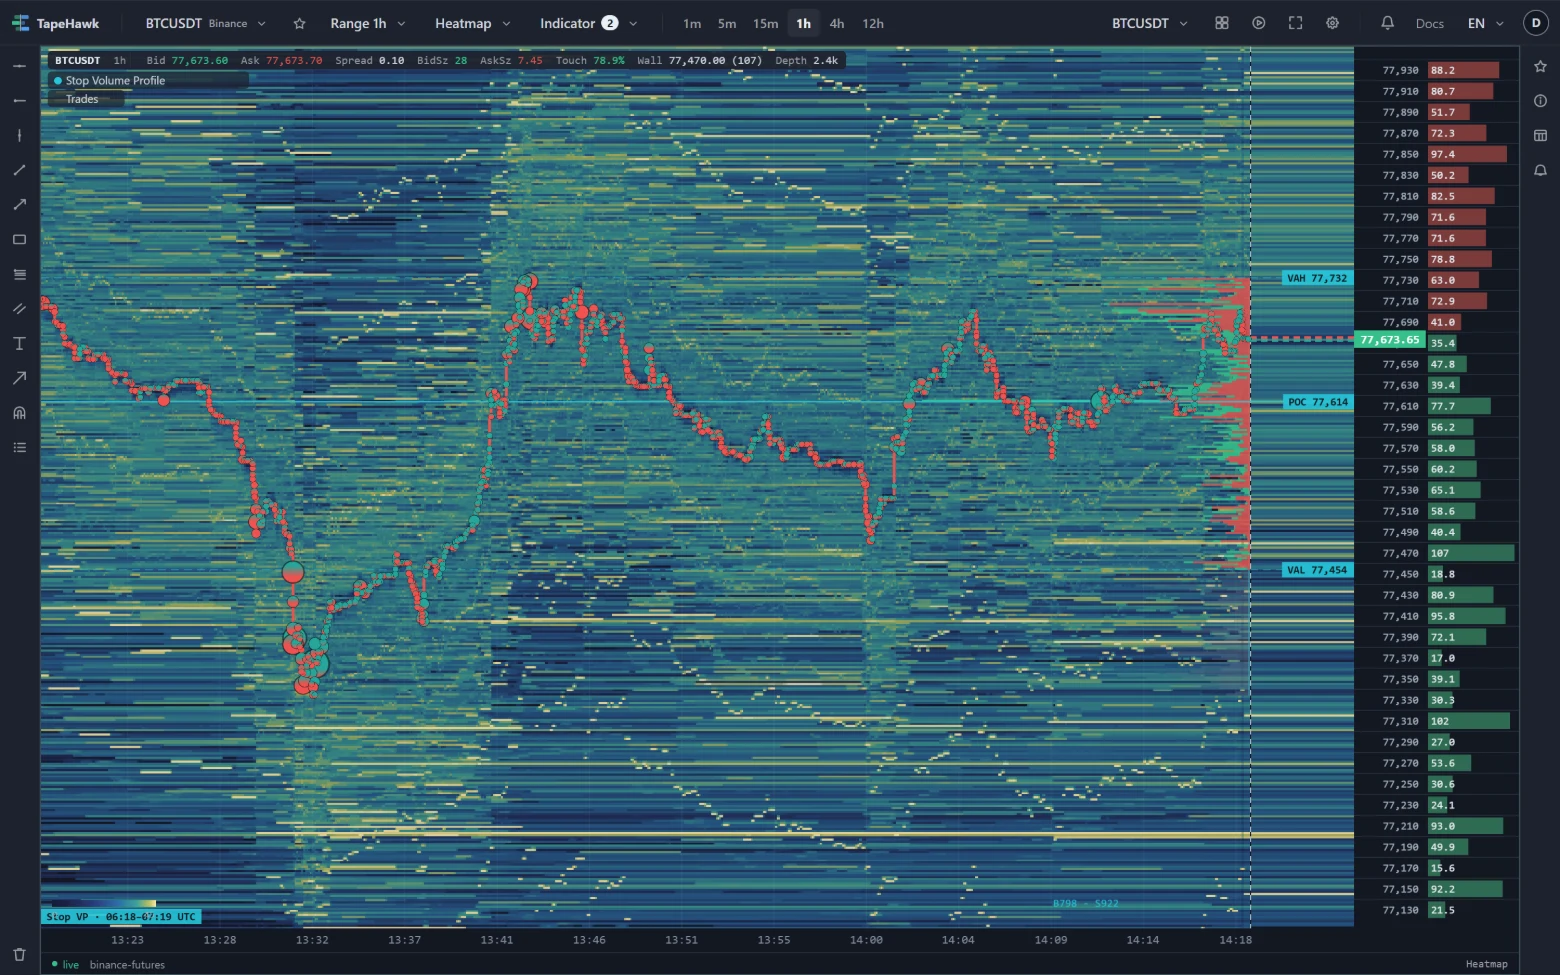
The result is far sparser than the session profile: most trading never qualifies, and the rows that fill up are the prices where stops were run.
It gathers the trades the heatmap panel is holding — the stretch its range covers, plus any history you have scrolled into — rather than a fixed session, and the chip at its foot names the stretch it covers. By default it grows from the right-hand side, so it can sit opposite a Volume Profile growing from the left and the two can be read together.
The POC, value area, figures and high-volume lines work as they do on Volume Profile.
How to read it
- Tall rows are prices where stop cascades went through the book. Price that returns there meets a level where positions were forced out before.
- Selling at the bid rows mark where long positions were stopped out on the way down; buying at the ask rows, where shorts were squeezed on the way up.
- Side by side with Volume Profile, compare where the market did its normal business with where it was forced: a stop cluster far from the session's value area is a move that ran on stops rather than on participation.
Parameters
| Setting | Control | What it does |
|---|---|---|
| Price range (levels) | Number | How many distinct price levels a run must cross before its size counts as stops. This stands in for a field the exchange does not publish: a stop cascade fills through several levels in one motion, and that shape is what the tape can still show. The same gate Sweeps and Stop Volume use, so a reader who sets 2 here has selected the same runs. 1–1000 · default 20 |
| Gap (ms) | Number | How long a silence ends the run. Below this, the next print is treated as part of the same aggressive order. 5–5000 · default 250 |
| Price step (ticks) | Number | How many venue ticks fold into one row. Larger means thicker rows and fewer of them. 1–1000 · default 20 |
| Value area (%) | Number | Share of volume counted into the value area around the POC. The industry standard is 70. 50–100 · default 70 |
| Show VAH / VAL | On / off | Draws the upper and lower edges of the value area (VAH and VAL). |
| Width (% of plot) | Number | How far the bars may reach across the plot, as a percentage of its width. They grow from the left edge. 5–40 · default 25 |
| Colour | Colour | |
| Bid bar colour | Colour | |
| Ask bar colour | Colour | |
| Position (% of plot) | Number | How far the histogram has slid from its home edge. 0 keeps it there — the left edge when the bars grow right, the right edge when they grow left; 100 pushes it to the far side. 0–100 · default 0 |
| Direction | Choice Grow left · Grow right | Which way the bars grow, and therefore which edge they start from. default: Grow left |
| Split buyers and sellers | On / off | Draws bid and ask beside each other instead of stacking them into one bar. |
| Show numbers | On / off | Prints the traded size at the head of each bar. Only rows above a tenth of the largest are labelled. |
| Summary labels | Choice Bid B / Ask S · Bid S / Ask B · Bid ▲ / Ask ▼ · Bid ▼ / Ask ▲ · None | What the summary badge calls the two sides. The letter styles name the order side; the arrows leave the reading to you. default: Bid S / Ask B |
| Volume filter (%) | Number | Hides rows smaller than this share of the biggest one. The POC and the value area are found before the filter runs, so they can never be filtered away. 0–50 · default 0 |
| High volume lines | On / off | Rules the busiest levels right across the chart. Off by default, because the POC and the value area edges are already drawn. |
| Top levels | Number | How many of the busiest levels get a line. 1–20 · default 3 |
| Opacity (%) | Number | Dims the whole profile. It multiplies the existing shading rather than replacing it, so the value area stays readable. 10–100 · default 100 |
Price range (levels) is the whole filter: how many price levels a run must cross in one motion before its size counts. A level is one price step of the exchange, so the same number means a much bigger move on some symbols than on others — raise it on a symbol with fine price steps, lower it on a coarse one. Gap (ms) is how long a pause ends a run.
The other settings — rows, value area, placement and figures — are those of Volume Profile.
Limitations
- It is drawn on heatmap panels only, so only on symbols TapeHawk records.
- The exchange does not label stop orders: what it counts is runs shaped like stop cascades, which also catches an ordinary large order that walked the book.
- It covers only the trades the panel holds, so changing the range, or scrolling into history, changes what it shows. On a busy symbol the panel holds a few hours of trades at most.
- When nothing qualifies it says so at its foot —
Stop VP · no runs ≥and the number of levels — and lowering Price range (levels) is the way to see more.
Volume Profile
How much traded at each price over the current session, as a horizontal histogram split into bid and ask, with the point of control and the value area.
Big Trade Profile
A horizontal histogram of where the large trades went, built from the individual executions above a size you set rather than from all the volume.