S/R Zones
Support and resistance zones drawn on a footprint panel where a large amount of aggressive volume went through one band of prices, decisively on one side — the more it absorbed, the heavier the band.
Price bands that SEVERAL separate columns worked the same way — each column's run of stacked imbalance is one vote, and a band is drawn where enough of them agree. The stronger the agreement the heavier the band. A band leaves when price closes through it, or when the columns that made it age out of memory.
- Footprint
- 1m, 5m, 15m, 1h
- Not drawn on
- Renko, Range bars, Line break — This chart type has no time axis, so order-flow indicators cannot be plotted on it
- Needs
- the instrument's price grid — without it the chart shows: “Instrument tick unknown — this indicator needs the exchange price grid”
- Alerts
- yes
What it shows
On a footprint panel, a shaded zone at every price band that absorbed a large amount of aggressive volume, decisively on one side.
Each closed bar is read for runs of price levels imbalanced in one direction — several levels in a row where buyers overwhelmed sellers, or sellers overwhelmed buyers. Each run is then measured: how much the winning side put through it beyond what the other side did. A zone appears where those amounts add up to a large one at the same price.
Two things follow from measuring rather than counting, and they are the whole of the indicator:
- A single bar can be a zone. One bar that puts an enormous one-sided amount through one price is exactly what a footprint reader calls support, and it does not need a second bar to agree.
- A busy price is not automatically a zone. A level where fifty thousand bought and fifty thousand sold is the busiest kind of balance, which is the opposite of a level. Only the excess counts.
Because the amounts add up over the bars still in memory, size and repetition are one number: a single huge bar reaches the threshold, and so do several ordinary bars that kept coming back to the same price. That sum is also what the band's weight shows.
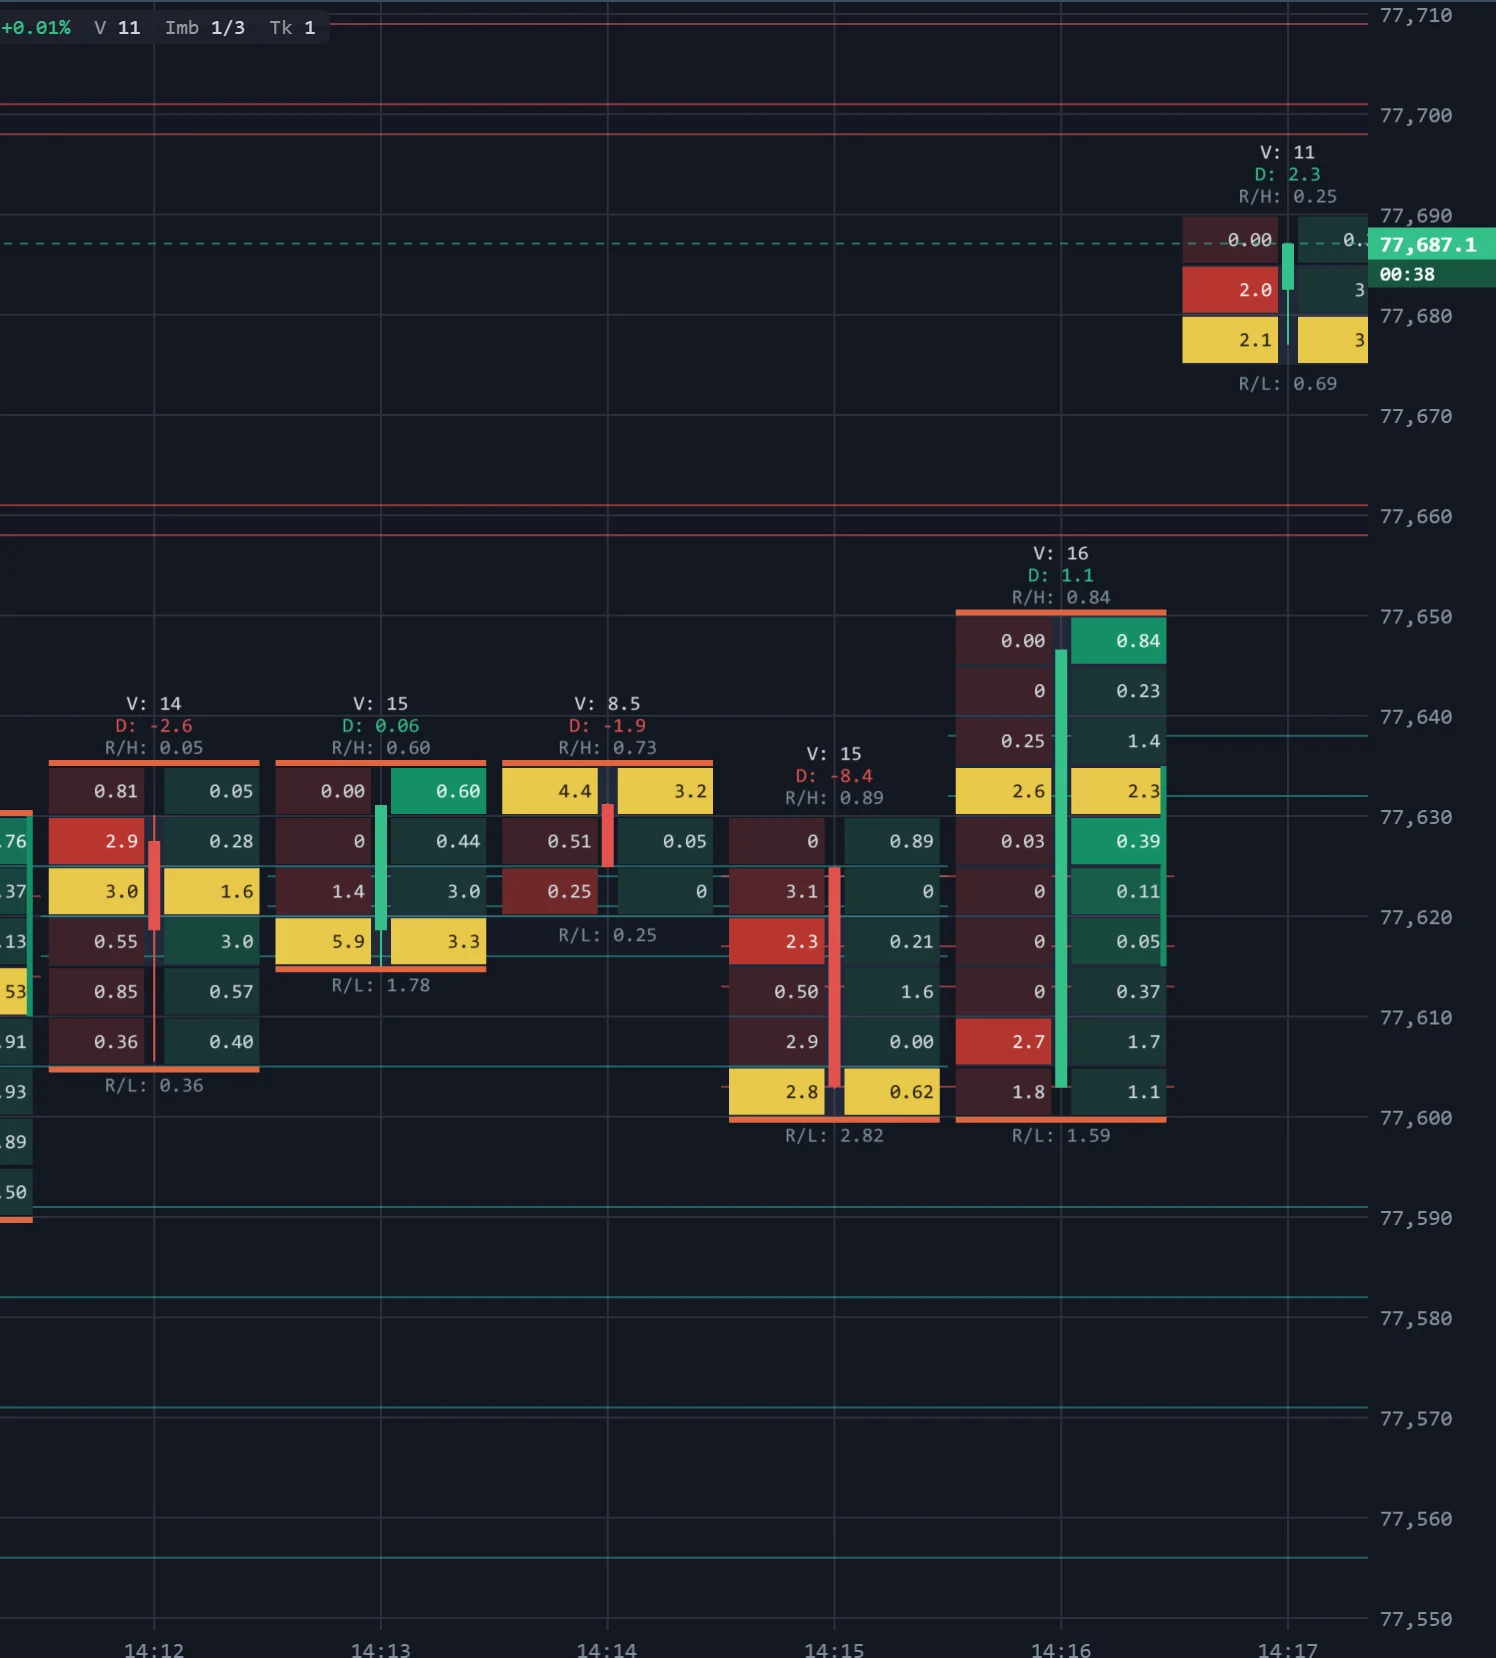
- A run of buying imbalance is drawn in the buying colour and read as support.
- A run of selling imbalance is drawn in the selling colour and read as resistance.
Each zone is drawn in two parts. A solid box sits on the most recent bars that actually worked the level, so you can see where the evidence came from. From there the zone continues as a faint tinted band between the same two prices, bar by bar, until it ends — light enough to read the footprint cells through, and that is what you hold the current price against. The more bars agree, the heavier the whole thing is drawn, so the levels worth watching stand out from the ones that merely qualified.
A zone ends in one of two ways. Price closes through it, which says the level did not hold. Or the bars that made it age out of memory: nothing has worked that band for a while, so it stops being drawn. The second is why old levels no longer pile up along the top of a long session.
The imbalance is the same diagonal comparison the footprint uses to colour its cells — see Stacked imbalances.
A zone will not always sit on lit cells in the bar you are looking at. It is a statement about many bars, not about the one under your cursor, so it is drawn wherever those bars put their volume — including across a bar that shows nothing itself. That is the indicator working, not a fault.
How to read it
- A heavy zone is a band that absorbed a lot of one-sided volume — whether from one huge bar or from many bars returning to it. Price coming back to a support zone is testing the buying that built it; to a resistance zone, the selling. The weight is the evidence — prefer the dark bands.
- A faint zone only just cleared the threshold. A level to watch, not a level to lean on.
- A zone that ends on a close through it is a level that did not hold. Which bar counts as ending it is up to you, from the first touch to a close beyond the far edge.
- A zone that fades away was abandoned rather than broken: price moved on and stopped working it.
- Compare with Absorption Zones, which marks the same kind of run when the bar then closed away from it — the same levels with the opposite meaning.
Parameters
| Setting | Control | What it does |
|---|---|---|
| Price step (ticks) | Number | Range and default are set by TapeHawk; the settings dialog shows them. |
| Imbalance ratio | Number | Range and default are set by TapeHawk; the settings dialog shows them. |
| Levels in a row | Number | Range and default are set by TapeHawk; the settings dialog shows them. |
| Hide rows under | Number | Range and default are set by TapeHawk; the settings dialog shows them. |
| Zone size (typical bars) | Number | Range and default are set by TapeHawk; the settings dialog shows them. |
| Remember for | Number | Range and default are set by TapeHawk; the settings dialog shows them. |
| Zone ends when | Choice a bar closes through it · price touches it · a wick goes through it | Which bar takes the zone off the chart. A close beyond the far edge is the quietest of the three and the default — the three nest, so anything that closes through has already wicked through and already touched. Touch is the eagerest: the first bar that reaches the near edge ends it. default: a bar closes through it |
| Max marks / minute | Number | How many zones a minute may raise an alert. It bounds notifications only — every zone the rule finds is still drawn. 1–60 · default 20 |
| Buying colour | Colour | |
| Selling colour | Colour |
Zone size (typical bars) is the FLOOR: how much one-sided volume a level has to have absorbed before it is drawn, measured in typical bars of this market. At 1.0 a level has taken as much one-sided flow as an ordinary bar of this symbol carries altogether. It is measured against the market's own bars rather than in lots, because an absolute size is a different rule on every symbol — the median band runs hundreds of times larger on one instrument than another.
It is not the whole gate. A zone is a price band the market worked more than the prices around it — a peak in the evidence, not merely a level that cleared a bar. On a busy market that second test is the one doing the work, so raising this changes less than you would expect; where it still decides is a quiet market, where nothing stands far above anything else.
Remember for is how many bars back a bar’s contribution keeps counting. It is the forgetting, and the only thing that clears a level price has stopped visiting. It is counted in bars because the contribution comes from a bar: the same number of MINUTES would be 180 bars of memory on a one-minute chart and three on an hourly one, which painted levels across whole screens on the first and left the second with almost nothing to add up on.
The rest shape the evidence rather than the verdict. Imbalance ratio is how much one side has to outweigh the other before a level counts as imbalanced, and Levels in a row how many such levels in a row make one run — looser is better here, because the size threshold is what filters. Price step (ticks) groups the exchange's price steps into rows first, and Hide rows under leaves thin rows out, like the footprint panel's own Hide dust rows.
Zone ends when picks the bar that takes a broken zone off the chart: the first to touch its near edge, the first to wick beyond its far edge, or — the default — the first to close beyond its far edge. A zone nobody works any more leaves through Remember for instead. Max marks / minute concerns only alerts; it never limits the drawing.
Alerts
The Alert tab has one signal, zone. Switch it on and TapeHawk tells you when a
band on this symbol absorbs enough one-sided volume to become a zone, with its price range and side. The message cannot yet
say how much it absorbed — the chart shows that as the band’s weight. The rule watches bars of the panel's
timeframe — the same settings find different zones on 1m and 5m bars — so switch it on from a panel at the timeframe
you want. It uses the settings on the Parameters tab at the moment you switch it on; if you change them later, the tab
offers to bring the alert along. The alert comes once the bar has closed, not while it forms, and reaches you at most
as often as the default Max marks / minute allows. Alerts need a confirmed account;
Signal alerts covers the rest.
Limitations
- It is drawn on footprint panels only, at 1m, 5m, 15m and 1h, and needs the symbol's price steps.
- Zones are found on closed bars, so the bar still forming has none yet.
- It reaches back 24 hours on a symbol TapeHawk records, and about half an hour on a live-only symbol.
- A panel draws a few hundred zones at most, so on a long history some are left out.
- The zones use their own settings, not the footprint panel's: if the two disagree, a zone can sit beside cells the footprint does not light.
TPO (Market Profile)
A letter for every period at each price that traded in it — the shape of each session, its TPO point of control, value area, initial balance and single prints.
Absorption Zones
Zones on a footprint panel where one side pushed through several levels and the bar then closed away — aggression that met resting size and failed, drawn as support or resistance.