MACD
Moving average convergence divergence — the gap between a fast and a slow EMA, its signal line, and a histogram of the difference, in a band under the price.
The gap between two moving averages, with a signal line and a histogram of the distance between them.
- Candles
- 1m, 3m, 5m, 15m, 30m, 1h, 2h, 4h, 6h, 12h, 1d, 1w, 1M
- Footprint
- 1m, 5m, 15m, 1h
- Alerts
- no
What it shows
Three things in one band under the price plot:
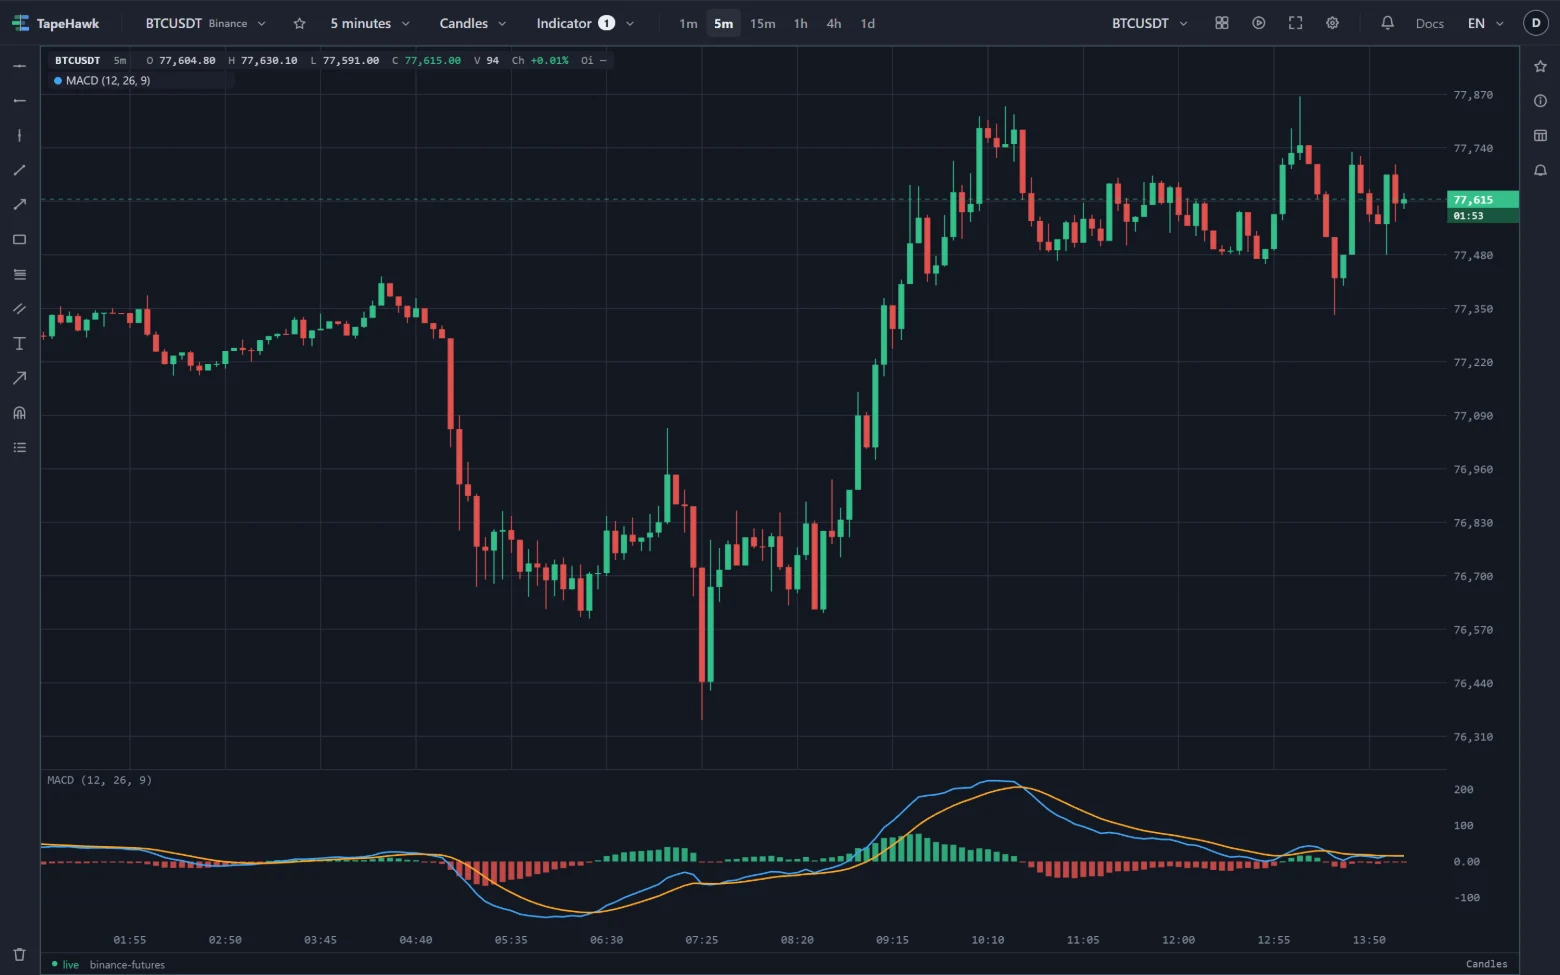
- The MACD line — a fast EMA of the closes minus a slow one. It is above zero when the fast average is above the slow one, and below zero when it is under.
- The signal line — an EMA of the MACD line itself, so it follows the MACD line with a delay.
- The histogram — the MACD line minus the signal line, drawn as columns from zero: in the up colour above zero and the down colour below.
The band's scale always includes zero. Its name — MACD (12, 26, 9) — is followed by the three values at the
candle under the pointer, in that order: MACD, signal, histogram.
How to read it
- Signal-line crosses. The MACD line crossing above the signal line — the histogram turning from below zero to above — is the usual buy signal; crossing below, the sell signal.
- Zero-line crosses. The MACD line crossing zero means the fast average has crossed the slow one: a slower, broader sign of a change in trend.
- The histogram's shape. Columns growing mean momentum is building in their direction; columns shrinking back towards zero mean it is fading, often before the lines cross.
- Divergence. Price making a new high while the MACD line makes a lower high shows the rise has less momentum behind it — and the reverse at lows.
Parameters
| Setting | Control | What it does |
|---|---|---|
| Fast length | Number | Fast EMA period. Its gap from the slow EMA is the MACD line itself. Standard 12. 1–200 · default 12 |
| Slow length | Number | Slow EMA period. The further it sits from the fast one, the wider MACD swings. Standard 26. 2–400 · default 26 |
| Signal length | Number | Smoothing period for the signal line. The histogram is the gap between MACD and it. Standard 9. 1–100 · default 9 |
| MACD line colour | Colour | |
| Signal line colour | Colour | |
| Height (%) | Number | Height of the band, as a percentage of the panel. Dragging the band's edge changes it too. 8–50 · default 18 |
Fast length and Slow length are the two EMAs; the further apart they are, the wider the MACD line swings. Signal length sets how closely the signal line follows. The chart does not stop the fast length being set above the slow one — doing so turns the MACD line upside down.
Height (%) is the band's share of the panel's height; dragging the band's top edge changes it too.
Limitations
- It is computed from the candles loaded on the panel. The MACD line starts once there are enough candles for the slow EMA, and the signal line and histogram start later still. Values near the start of the loaded history can differ slightly from a chart that loaded more; they settle after a few lengths.
- The values are in price units, so they are not comparable between symbols, and the band's scale fits the values on screen.
- Crosses come after the move has begun, since every part of it is built from averages.
- The newest candle's close is the live price, so the last values — and a cross on that candle — can change until it closes.
- It takes one of the panel's two band places — see Over the price, and in bands.
- It follows the candle shape: on Heikin Ashi it uses the real closes, and on Renko, range bars and line break the closes of the bricks and bars drawn — see Where an indicator can be drawn.
- It takes no alert. Its Alert tab says it draws no signal.