Stochastic
The stochastic oscillator — where the close sits within the recent high-low range, from 0 to 100, with a smoothed %K and a %D signal line.
Places the close within the recent high–low range, on a 0–100 scale.
- Candles
- 1m, 3m, 5m, 15m, 30m, 1h, 2h, 4h, 6h, 12h, 1d, 1w, 1M
- Footprint
- 1m, 5m, 15m, 1h
- Alerts
- no
What it shows
Two lines in a band under the price plot, on a fixed 0–100 scale:
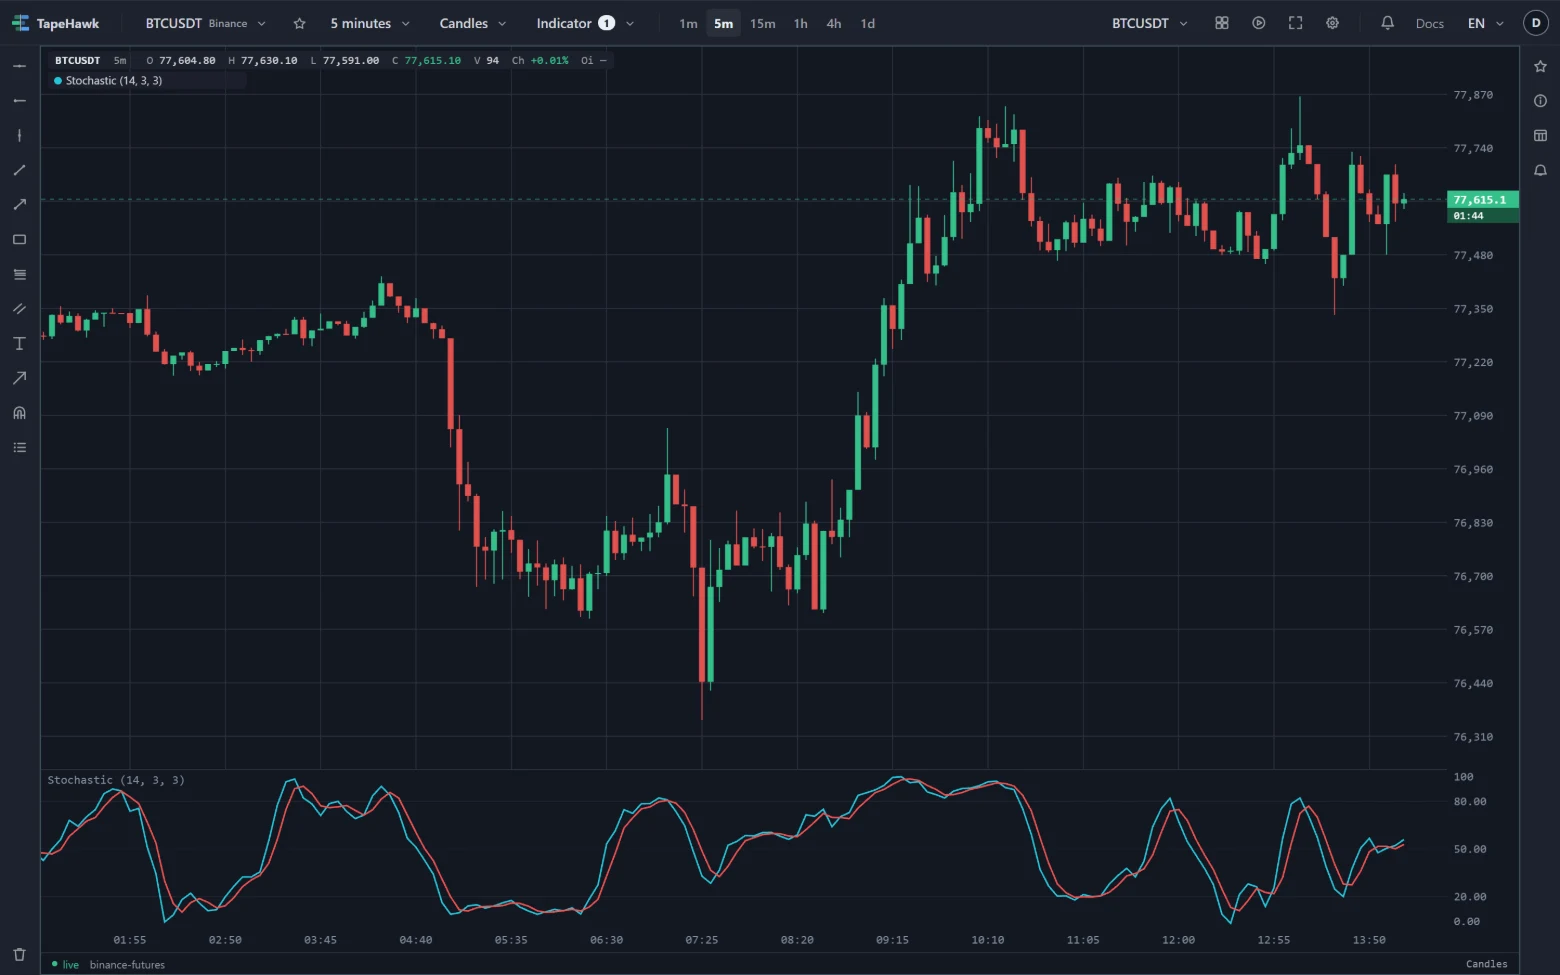
- %K places the close within the range of the recent candles: 100 means it closed at the highest high of that stretch, 0 at the lowest low, 50 halfway. The chart smooths it before drawing it — the "slow" stochastic.
- %D is an average of %K, so it follows %K with a delay.
The band has guide lines at 20 and 80 and a fainter one at 50. Its name — Stochastic (14, 3, 3) — is followed by
the values of %K and %D at the candle under the pointer.
How to read it
- Above 80 and below 20. Closes near the top of the recent range put the stochastic above 80, the conventional overbought zone; near the bottom, below 20, oversold. In a trend it can stay there for a long time, which is itself a sign of strength.
- %K crossing %D. %K crossing above %D is the usual buy signal and crossing below the sell signal. A cross that happens below 20 or above 80 carries more weight than one in the middle.
- Divergence. Price making a new low while the stochastic makes a higher low suggests selling is losing force — and the reverse at highs.
Parameters
| Setting | Control | What it does |
|---|---|---|
| %K length | Number | How many candles %K scans for its high and low. Smaller is jumpier. 1–200 · default 14 |
| %D length | Number | Averaging period for the %D signal line drawn from %K. This is not the %K smoothing. 1–100 · default 3 |
| %K smoothing | Number | Smooths raw %K before drawing — the “slow” in slow stochastic. Different from the %D period. 1–100 · default 3 |
| %K colour | Colour | |
| %D colour | Colour | |
| Height (%) | Number | Height of the band, as a percentage of the panel. Dragging the band's edge changes it too. 8–50 · default 18 |
%K length sets how many candles the high-low range is taken over. A short stretch makes the stochastic jumpy; a long one steadies it. %K smoothing smooths %K before it is drawn, and %D length sets the average that makes %D. The two are separate: changing one does not change the other.
Height (%) is the band's share of the panel's height; dragging the band's top edge changes it too.
Limitations
- It is computed from the candles loaded on the panel. %K starts once there are enough candles for the range and its smoothing, and %D after that.
- If the highest high and lowest low of the stretch are the same — a completely flat market — there is no range to place the close in, and the lines have a gap there. The gap runs on for a few candles after the flat stretch, while the smoothing and %D fill up again.
- The guide lines are fixed at 20 and 80 and cannot be moved.
- The newest candle is still trading, so the last values move until that candle closes.
- It takes one of the panel's two band places — see Over the price, and in bands.
- It follows the candle shape: on Heikin Ashi it uses the real candles, and on Renko, range bars and line break the bricks and bars drawn — see Where an indicator can be drawn.
- It takes no alert. Its Alert tab says it draws no signal.