CVD
Cumulative volume delta — aggressive buying minus aggressive selling, as a running total or bar by bar, in a band under the chart.
Runs the difference between aggressive buying and aggressive selling.
- Candles
- 1m, 5m, 15m, 1h
- Footprint
- 1m, 5m, 15m, 1h
- Heatmap
- any range
- Not drawn on
- Renko, Range bars, Line break — This chart type has no time axis, so order-flow indicators cannot be plotted on it
- Alerts
- no
What it shows
Every trade has an aggressor: a buyer who lifted the ask, or a seller who hit the bid. Delta is the buying volume minus the selling volume, and CVD keeps a running total of it. The band under the chart draws that total as a line, or each bar's own delta as a column.
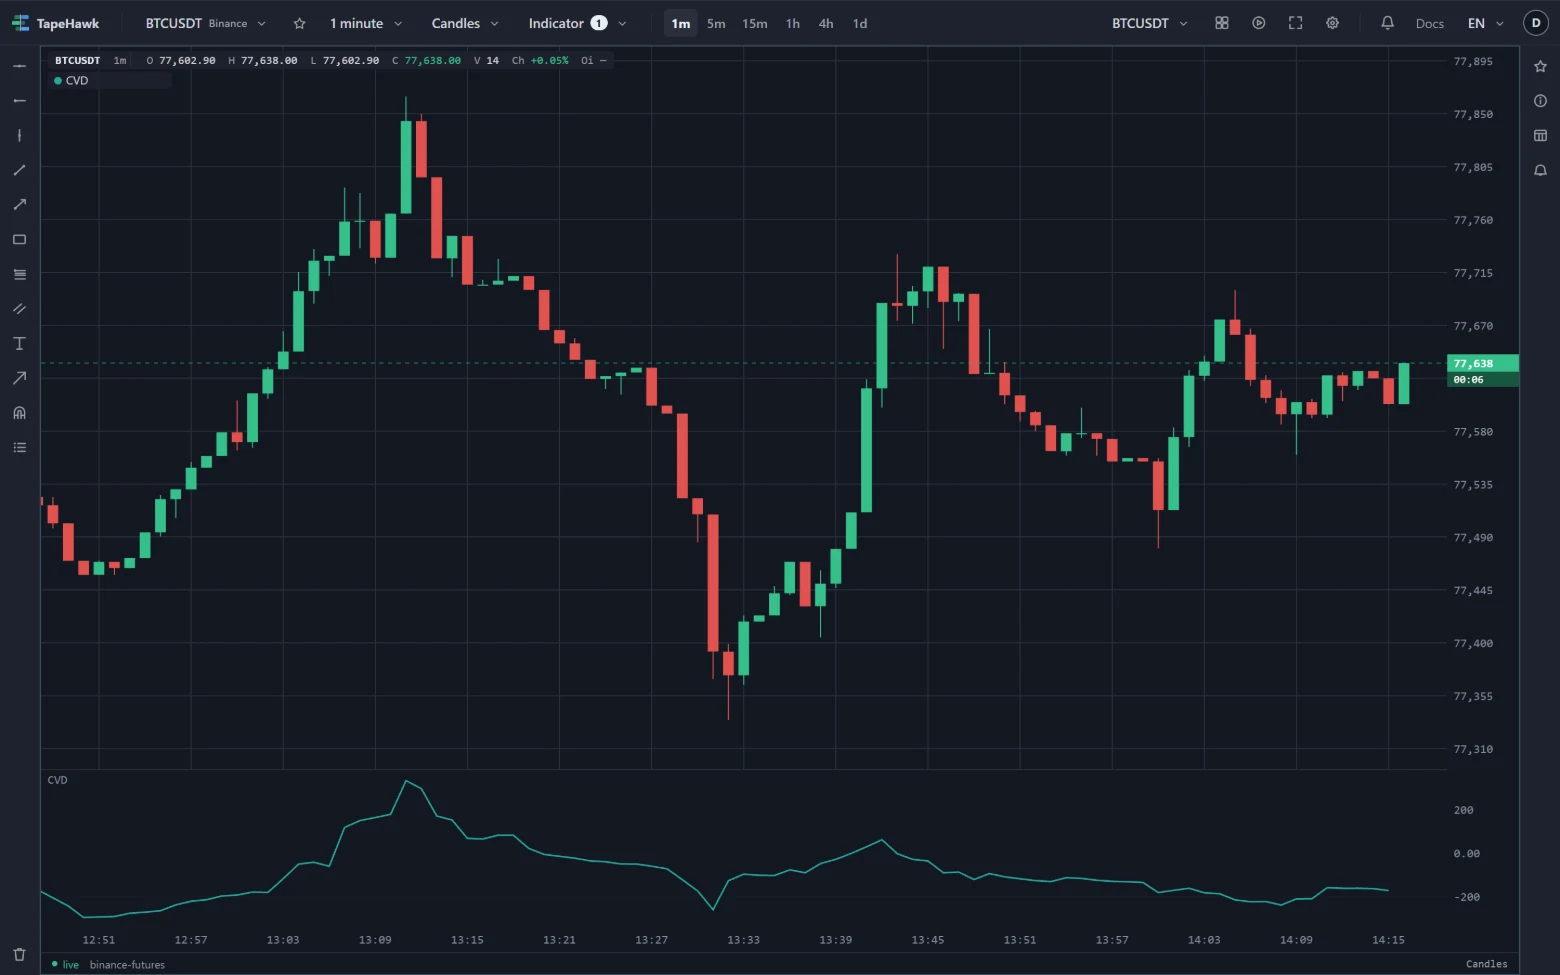
TapeHawk works it out from the trades themselves, not from the candles: a green candle can still carry negative delta, and CVD shows it.
On a candles or footprint panel the line has one value per bar. On a heatmap it is worked out one minute at a
time and held flat across the narrower heatmap columns; the band's name shows that width — CVD 1m.
How to read it
- Agreement. CVD rising with price says aggressive buyers are driving the move; falling with price, sellers.
- Divergence. Price making a new high while CVD makes a lower one says the high was reached on less aggressive buying than the last — often passive sellers absorbing it. The reverse at lows.
- Pressure without movement. CVD climbing while price stays flat means buyers keep lifting offers that are refilled. Where that happens, and what price does when the buying stops, is often worth watching.
- Delta bars show each bar on its own: a tall column is a bar where one side dominated, whatever the running total did before it.
Parameters
| Setting | Control | What it does |
|---|---|---|
| Draw as | Choice Cumulative line · Delta bars | The default is set by TapeHawk; the settings dialog shows it. |
| Anchor | Choice Daily (UTC) · From session start | The default is set by TapeHawk; the settings dialog shows it. |
| Intrabar delta envelope | On / off | Shades how far the delta ran INSIDE each bar — the CVD equivalent of a candle wick. Made for the histogram mode, where the bar is the delta itself; on the running-total line the two edges sit one bar's delta from it and are usually too small to see. |
| Split buyers and sellers | On / off | Draws aggressive buying and aggressive selling as their own lines beside the difference, so a bar where both sides were busy is told apart from one where neither was. |
| Height (%) | Number | Height of the band, as a percentage of the panel. Dragging the band's edge changes it too. 8–50 · default 18 |
| Colour | Colour | |
| Buying colour | Colour | |
| Selling colour | Colour |
Draw as switches between Cumulative line, the running total, and Delta bars, each bar's own delta drawn from zero in the up or down colour. Both read the same numbers.
Anchor decides where the running total starts again. Daily (UTC) returns it to zero at 00:00 UTC, and the line is broken there rather than drawn as a drop. From session start runs it on without a daily reset: each day carries on from the previous day's last total, starting from the oldest bar the panel has loaded. Every panel kind, heatmap included, keeps the anchor you chose, and the band's name says which.
Split buyers and sellers adds aggressive buying and aggressive selling as lines of their own, in their own colours, so a bar where both sides were busy can be told apart from one where neither was. Intrabar delta envelope shades how far the delta ran inside each bar, like a wick. It is made for delta bars; around the running total it is usually too thin to see.
Limitations
- On candles and footprint it draws only at 1m, 5m, 15m and 1h, and not on Renko, range bars or line break.
- Each bar's value arrives once the bar has closed, so the line stops at the last closed bar.
- It reaches back 24 hours on a symbol TapeHawk records: scroll further back and the line stops, even though the candles go on. On a live-only symbol it reaches back only about half an hour.
- With From session start the level depends on where the total started, and scrolling back into an earlier day can move the whole line up or down without changing its shape. Compare its slope and turns, not its value, across days or panels.
- The band's scale fits the values on screen, and it always includes zero.
- On a heatmap it makes every indicator TapeHawk works out for that panel use one-minute steps, including V-Delta and the other bands that would otherwise follow the range more finely.
- It takes one of the panel's two band places — see Over the price, and in bands.