V-Delta
Aggressive buying minus aggressive selling with older trades fading out — who is pressing right now, in a band under the heatmap.
Aggressive buying minus aggressive selling, with older trades fading out. Reads who is pressing now rather than who pressed today.
- Heatmap
- any range
- Alerts
- no
What it shows
A line in a band under a heatmap: aggressive buying minus aggressive selling, where every trade counts in full when it prints and then fades away, at a pace set by Half-life. So the line reads who is pressing now, rather than who has pressed since the start of the day as CVD does.
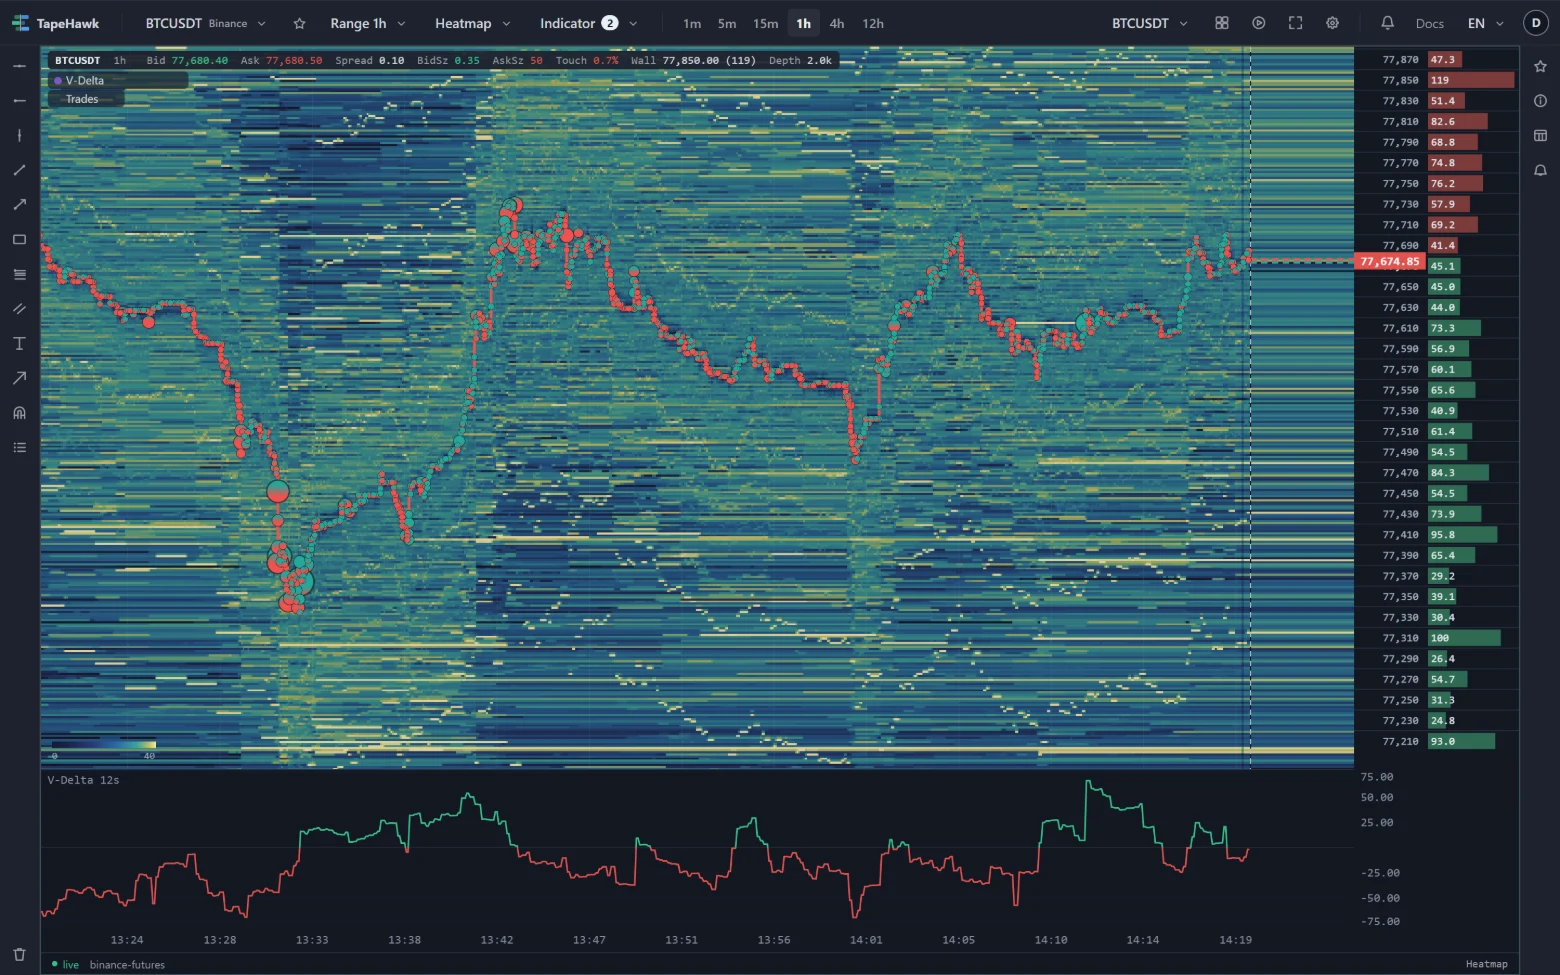
The line takes the up colour above zero and the down colour below it, changing exactly where it crosses. It
updates live; the heatmap draws it at the width shown beside its name — V-Delta 12s, say — which
follows the panel's range. With CVD, RVOL or
VPOC on the same panel, the width is one minute whatever the range.
How to read it
- Side of zero. Above zero, aggressive buyers have outweighed sellers over the recent past; below, sellers.
- Surges. A sharp swing away from zero marks a burst of one-sided aggression. Where it happens on the heatmap — at a wall, into thin liquidity — says more than its size.
- Fading. The line falling back towards zero while price keeps moving says the push behind the move is weakening.
- Divergence. Price pressing to a new high while V-Delta peaks lower suggests the new high took less aggression than the last one.
- Market Volume Imbalance marks the moments this same reading tips hard to one side as events on the heatmap itself.
Parameters
| Setting | Control | What it does |
|---|---|---|
| Half-life | Choice 15 seconds · 30 seconds · 1 minute · 2 minutes · 5 minutes | The default is set by TapeHawk; the settings dialog shows it. |
| Units | Choice Volume · Share (%) | The default is set by TapeHawk; the settings dialog shows it. |
| Reference level | Number | Draws a dashed line at plus and minus this value. It marks a level to watch; it does not arm an alert — that lives on the alert rule. 0 hides it. 0–100 · default 0 |
| Draw as | Choice Signed line · Delta bars | Only the drawing changes, never the number. Bars read the winning side faster; the line reads how it got there. Remember that neighbouring columns overlap — each one is the decayed reading at the moment it closed, not that column's own trading, so a row of tall bars is one push seen several times. default: Signed line |
| Height (%) | Number | Height of the band, as a percentage of the panel. Dragging the band's edge changes it too. 8–50 · default 18 |
| Colour | Colour |
Half-life sets how quickly trades fade. A short half-life reacts to each burst and drops back quickly; a long one shows the broader lean of the session and smooths the bursts away.
Units sets what the number is. Volume is the difference in the symbol's own units, so it compares only with itself on the same symbol. Share (%) gives it as a signed percentage instead, which means the same on any symbol.
Reference level draws dashed lines at plus and minus the level you set, while the band's scale reaches them; at 0, the default, there are none. They only mark a level; they do not set an alert.
Draw as can draw columns instead of the line. Each column is the reading at the moment that column closed, not the trading inside it, so neighbouring columns share the same recent trades: a row of tall columns is one push seen several times, not a push that kept growing.
Limitations
- It is drawn on heatmap panels only, so only on symbols TapeHawk records.
- It reaches back 24 hours; scroll the heatmap further back and the band has nothing to draw.
- Volume readings do not compare between symbols, and the band's scale fits the values on screen.
- If TapeHawk stops sending values, the line dims and its row in the info bar shows ⚠ The server has stopped sending values for this indicator. What is drawn is the last it sent, dimmed; it fills in again by itself.
- It takes one of the panel's two band places — see Over the price, and in bands.