TPO (Market Profile)
A letter for every period at each price that traded in it — the shape of each session, its TPO point of control, value area, initial balance and single prints.
A letter for every period at each price that traded in it: the shape of the session, its TPO point of control, value area and initial balance.
- Candles
- 1m, 3m, 5m, 15m, 30m, 1h, 2h, 4h, 6h, 12h, 1d, 1w, 1M
- Footprint
- 1m, 5m, 15m, 1h
- Not drawn on
- Renko, Range bars, Line break — This chart type has no time axis, so order-flow indicators cannot be plotted on it
- Alerts
- no
What it shows
Each session is cut into periods — 30 minutes by default — and each period gets a letter: A for the first, B for the second, and so on; after Z come the lower-case letters, and after z the alphabet starts again (a day of 5-minute periods runs through it more than five times). A period's letter is written at every price row that traded during that period. Stacked side by side, the letters of a session draw its shape: wide where the market spent time, thin where it passed through.
A price counts as traded when there was a trade at it in that period, read from the stored order flow — not from the candle's high and low. A fast move that jumps over a few prices without trading them leaves those rows empty.
Each session is drawn inside its own stretch of the time axis, so several days sit side by side along the chart.
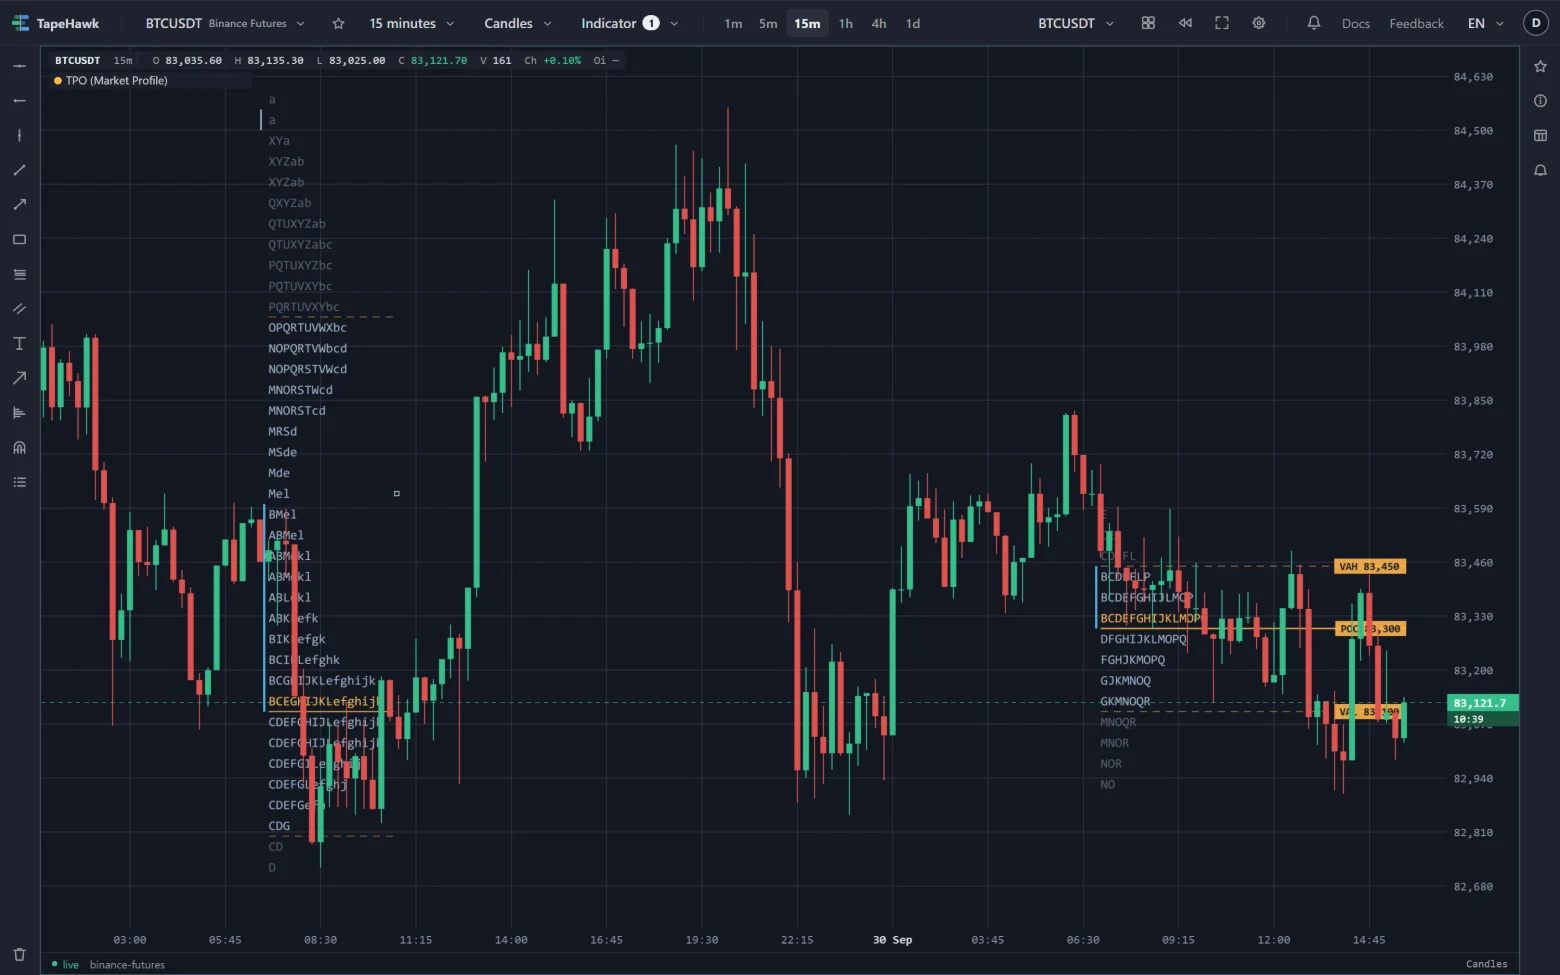
On it:
- TPO POC — the row with the most letters, in the indicator's colour. On a tie, the row nearest the middle of the session's range.
- Value area — the rows holding a set share of all letters (70% by default), grown out from the POC two rows at a time. Letters inside it are drawn brighter than the ones outside. VAH and VAL are the dashed lines.
- Initial balance — a vertical bar at the left of the session covering the range of its opening stretch: the first hour by default, rounded up to whole periods (a 45-minute period with a 60-minute balance covers 90 minutes). It appears once the session has run past it.
- Single prints — a small tick beside every row marked by only one period, away from the top and bottom of the session.
- Open and close — a filled square beside the row the session opened at, and an outlined square after the row it last closed at. The running session's close is not marked.
- Halfback (off by default) — a dashed line at the middle of the session's range.
When a row is too short, or a session too narrow on screen, to hold readable letters, the marks are drawn as small blocks instead. Zooming in brings the letters back. Split periods gives each period its own column, placed over that period's own stretch of the time axis, so the marks line up with the candles they came from.
How to read it
- Value area. Price spent most of its time between VAL and VAH. Opening outside it and failing to get back in says the market moved on; returning into it often carries through to the other side.
- Single prints. A run of single prints is a stretch price crossed quickly in one period. It is a gap in the auction that price often comes back to fill.
- Poor high or low. Several letters side by side at the very top or bottom row mean the extreme was tested repeatedly without a clean rejection, and is more likely to be taken out later. A single letter there — a tail — is a firmer rejection.
- Initial balance. A range break out of the first hour, and how far it runs, is the classic read of whether the day trends or rotates.
TPO counts time, not volume: the POC here and the POC of the Volume Profile on the same session can differ, and where they differ says whether price lingered where the size traded.
Parameters
| Setting | Control | What it does |
|---|---|---|
| Session | Choice 4 hours · 8 hours · Day | How far back volume is folded. Every option starts at a fixed anchor, never a rolling window. default: Day |
| Timezone | Choice UTC · My timezone · Ho Chi Minh (UTC+7) · Tokyo (UTC+9) · Hong Kong (UTC+8) · Dubai (UTC+4) · London · New York | Which clock anchors the session. Not a display setting — a Tokyo day and a UTC day cover different bars. default: UTC |
| From (hour) | Number | Only counts volume traded between these two hours of each day, on the chosen timezone's clock. 0 to 24 is the whole day; with New York, 9.5 to 16 is the US cash session. A start after the end wraps past midnight. 0–24 · default 0 |
| To (hour) | Number | The end of the daily window above, in hours on the chosen timezone's clock. 0–24 · default 24 |
| Period (minutes) | Number | How long each letter lasts. 30 minutes is the classic Market Profile period. 5–120 · default 30 |
| Price step (ticks) | Number | How many venue ticks fold into one row. 0 sizes rows automatically at about 0.05% of the price. 0–1000 · default 0 |
| Value area (%) | Number | The share of all TPOs the value area holds, counted in letters rather than volume. 50–100 · default 70 |
| Initial balance (minutes) | Number | The opening stretch whose range is marked as the initial balance. 0 turns it off. 0–240 · default 60 |
| Show as | Choice Letters · Blocks | Letters fall back to blocks by themselves when rows are too short or too narrow to read. default: Letters |
| Split periods | On / off | Gives every period its own column instead of pushing the letters of a row together. |
| Halfback | On / off | A dashed line at the middle of the session's range. |
| Level lines | Choice Inside the profile · Across the chart · Naked until revisited | POC, VAH and VAL inside the profile, across its session, or carried right from a finished session until price trades back at them. default: Inside the profile |
| Layout | Choice Current session · Every session | Current session draws one profile beside the price axis. Every session draws one profile inside each session's own stretch of the chart, with the previous sessions' POC and value area carried forward while price has not returned to them. default: Every session |
| Colour | Colour | |
| Letter colour | Colour | |
| Initial balance colour | Colour |
Price step (ticks) is the height of a row in ticks; 0 lets the server choose about 0.05% of the price (for example $50 rows on BTC near 84,000). Session, Timezone and the hours work as on the Volume Profile: the hours keep only that window of each day, and each session's periods are counted from its first minute inside the window — the window's opening, or the session's own start when it begins inside the window. A window that crosses midnight is read in time order within each session. Layout shows the running session alone or every recent session (18 four-hour, 9 eight-hour or 7 daily sessions). Level lines keeps POC, VAH and VAL inside the letters, across the session, or carries a finished session's levels right until price trades back at them.
Limitations
- It is built from the stored order flow, which keeps the last 30 days; older sessions are not shown. A symbol whose order flow is not stored shows nothing.
- Sessions longer than a day are not offered: a week at 30-minute periods is more letters per row than can be read.
- The periods run from the start of the session in the chosen timezone; the Local timezone cannot be used.
- A stretch with no stored bars — an outage — leaves its periods empty rather than guessing them.
- The running session refreshes once a minute, and every session is refetched every few minutes; the newest letters can lag the chart by up to a minute.
- It takes no alert.
Big Trade Profile
A horizontal histogram of where the large trades went, built from the individual executions above a size you set rather than from all the volume.
S/R Zones
Support and resistance zones drawn on a footprint panel where a large amount of aggressive volume went through one band of prices, decisively on one side — the more it absorbed, the heavier the band.