Absorptions
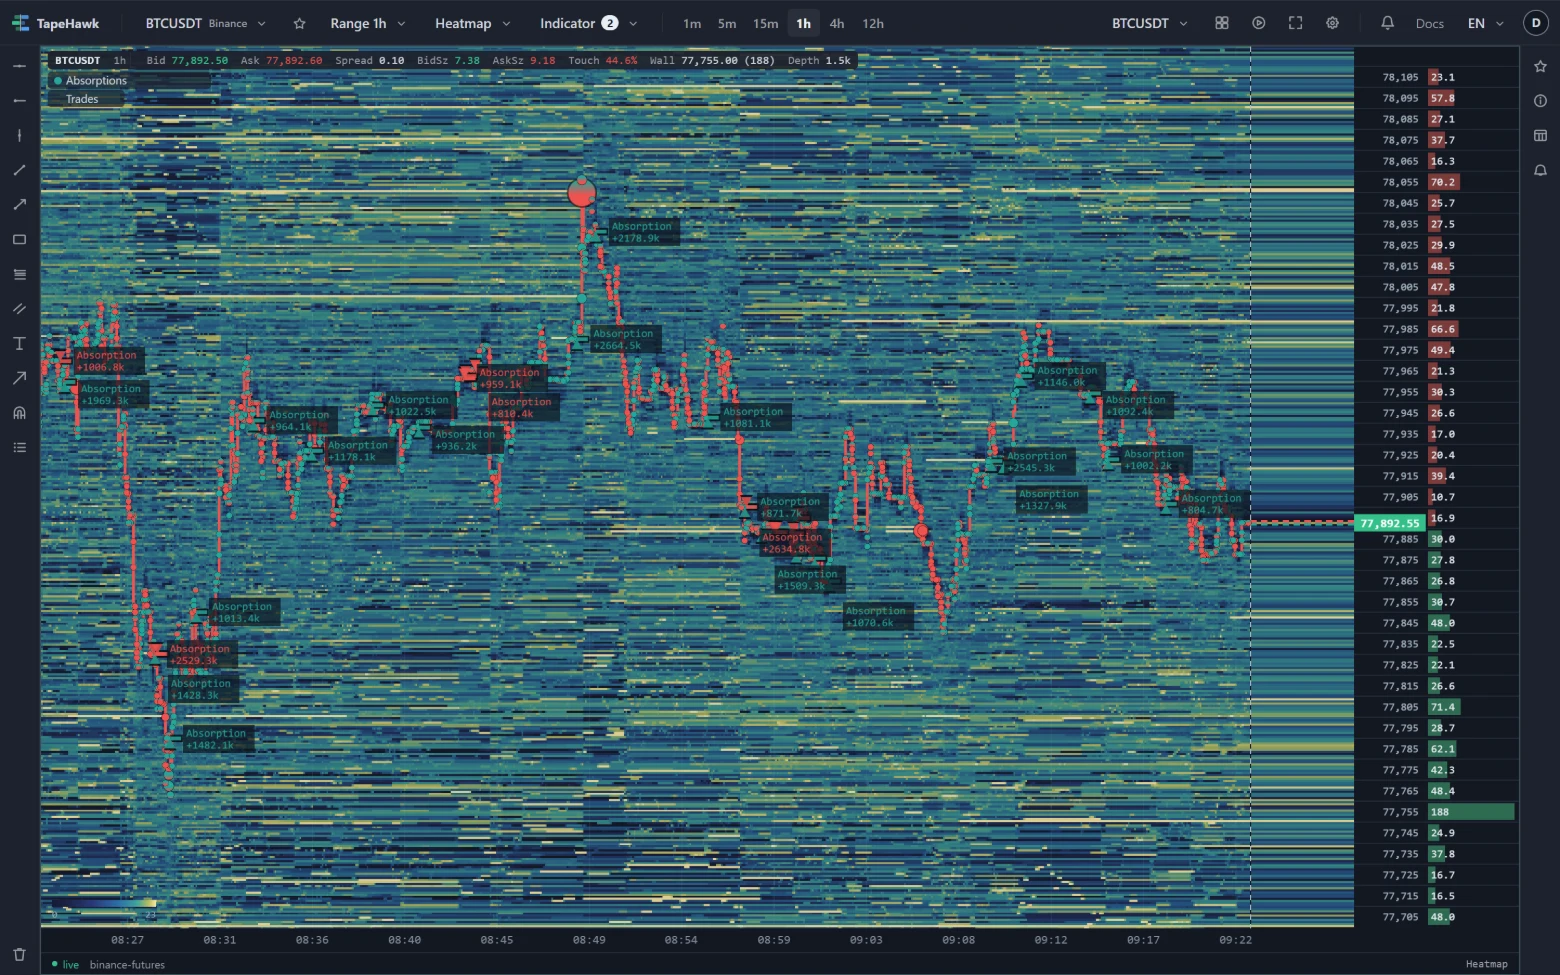
A mark on the heatmap where a large amount of aggressive size piled up while price stayed pinned in a narrow band — and then the band gave way.
A large amount of size piled up while the price stayed inside a narrow band — then the band gave way. The reference platform's rule reads this as absorption; what it marks is the moment the coil broke.
- Heatmap
- any range
- Alerts
- yes
What it shows
A mark on the heatmap where aggressive trading piled up without moving price: over a short window, a large amount of buying (or selling) traded while price stayed inside a narrow band. Size was going in and something was soaking it up. The mark is placed once that ends — when the band breaks or the pile-up fades — back at the price and moment the pile-up first became large enough to count.
The two sides are judged apart, never netted against each other.
The mark is a short level: a bar on the price where the size was absorbed, running to the right, with a wedge at its left end. The wedge hangs below the bar in the buying colour when it was aggressive buying that was absorbed, and sits above it in the selling colour for selling. The plate prints the size that piled up, in the quote currency. Figures, tooltip, held marks and history work as for every mark on the heatmap.
How to read it
- Buying absorbed is buying that did not lift price: resting sellers took it all. The level is where that happened, and it often acts as resistance — aggression failed there once.
- Selling absorbed is the mirror: resting buyers soaked up the selling, and the level often acts as support.
- What happens next is the reading. The mark comes once the pile-up is over, often as the band gives way: if price then moves in the direction the absorbed side was pushing, the passive side ran out; if it moves the other way, the absorption held.
- The colour says which side's size was absorbed, not which way to trade.
Parameters
| Setting | Control | What it does |
|---|---|---|
| Coil volume (M) | Number | Range and default are set by TapeHawk; the settings dialog shows them. |
| Coil window (ms) | Number | Range and default are set by TapeHawk; the settings dialog shows them. |
| Band (ticks) | Number | Range and default are set by TapeHawk; the settings dialog shows them. |
| Side | Choice Both · Bid · Ask | The default is set by TapeHawk; the settings dialog shows it. |
| Hold back marks the flow contradicts | On / off | The default is set by TapeHawk. |
| Hide held marks | On / off | A held mark is one this indicator decided not to assert: it is drawn as an outline with no label and sends no alert. The outline is there so you can judge the filter rather than trust it — you see the coil breaks it held back. Turn this on once you are satisfied and the outlines go; nothing is deleted, and turning it off puts every one of them back in the same frame. |
| Max marks / minute | Number | At most this many marks in any one minute, so a burst stays readable — and since 02/09 the same number is the ceiling on how often an alert rule on this signal may reach you. A rule takes THIS DEFAULT and keeps it: turning the knob on a panel changes the drawing only, because this knob is a DISPLAY setting and a rule inherits only what changes the numbers. The two can still differ at the edge of a busy minute, and the difference is deliberate: an alert is decided as each mark arrives and cannot be unsent, while the chart redraws the whole minute and lets a mark that was back-dated into it take a slot. Measured over 30 days of stored marks, this default is exceeded in 10.9% of the minutes that had an absorption at all (21.2% for stop hunts, 3.0% for sweeps). 1–30 · default 5 |
| Buying colour | Colour | |
| Selling colour | Colour |
Coil volume (M) is how much aggressive size must pile up, in millions of the quote currency. It is an absolute amount and its default is set for BTCUSDT, so lower it on a smaller symbol or the marks will hardly ever appear. Coil window (ms) sets how long the size and the price range are measured over, and Band (ticks) how tight that range must be, in the exchange's price steps. The three work together, so after changing one, check how often the marks appear before changing another.
Side limits the marks to absorbed buying (Ask), absorbed selling (Bid) or Both.
Hold back marks the flow contradicts holds back a mark while the recent order flow still leans the way the absorbed side was pushing — the tape disagreeing that anything was absorbed; see held marks.
Alerts
The Alert tab has one signal, absorb. Switch it on and TapeHawk tells you when an
absorption marks on this symbol, with its size, price and side. The alert uses the
settings on the Parameters tab at the moment you switch it on; if you change them later, the tab offers to bring the
alert along. Held marks send no alert, and an alert reaches you at most as often as the default
Max marks / minute allows. Alerts need a confirmed account; Signal alerts covers the rest.
Limitations
- It reads only the trades, not the order book: it cannot see the resting orders that did the absorbing, only that aggressive size went in and price did not move.
- The mark arrives after the moment it is placed at, once the band has given way or the pile-up has faded.
- It is drawn on heatmap panels only, so only on symbols TapeHawk records, and it reaches back 24 hours.
- The size is an absolute amount, so one setting does not fit every symbol.