WMA
The weighted moving average — an average of recent closes in which each newer candle counts one step more.
Linearly weighted average — newer candles weigh more, evenly rather than steeply like EMA.
- Candles
- 1m, 3m, 5m, 15m, 30m, 1h, 2h, 4h, 6h, 12h, 1d, 1w, 1M
- Footprint
- 1m, 5m, 15m, 1h
- Alerts
- no
What it shows
A line through the average of recent closing prices, drawn over the price, where the weights rise in even steps: the newest candle counts most, the one before it one step less, and so on down to the oldest candle in the length. A candle leaves the average completely once it is older than the length.
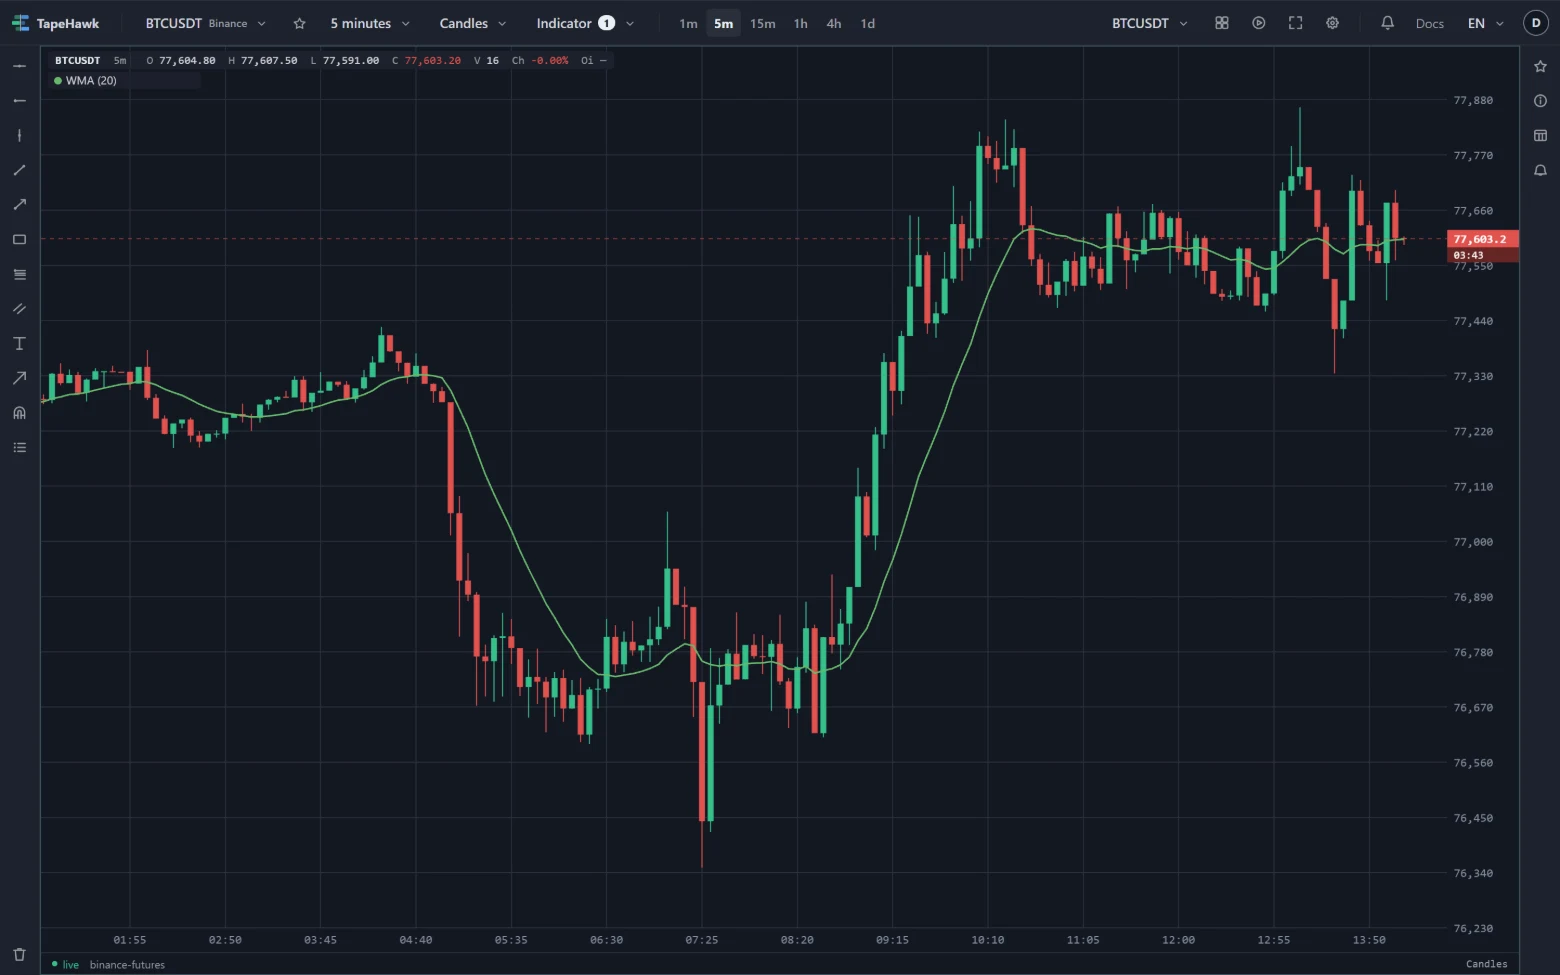
It sits between the other two averages: it turns sooner than an SMA, whose candles all count the same, and its weights fall off in straight steps rather than the gradual fade of an EMA.
How to read it
Read it like the other moving averages:
- Slope shows the direction of recent closes.
- Price against the line — closes above a rising WMA describe an uptrend, closes below a falling one a downtrend.
- Two lengths — a short WMA crossing a long one marks the recent average overtaking the older one.
Because the newest candles carry most of the weight, a WMA responds to the last few candles more than an SMA of the same length does, and follows short swings more.
Parameters
| Setting | Control | What it does |
|---|---|---|
| Length | Number | How many candles go into the average. Larger is smoother and slower to react. Common: 20, 50, 200. 1–1000 · default 20 |
| Colour | Colour |
Length is counted in candles. The oldest candles in a long WMA carry very little weight, so the line reflects mostly the newer part of its window.
Limitations
- It is computed from the candles loaded on the panel. The first candles of that history have no value until there are enough to fill the length.
- The newest candle's close is the live price, so the last point of the line moves until that candle closes.
- It follows the candle shape: on Heikin Ashi it uses the real closes, and on Renko, range bars and line break the closes of the bricks and bars drawn — see Where an indicator can be drawn.
- It prints no value: read it against the price axis.
- It takes no alert. Its Alert tab says it draws no signal; for a price level, set a price alert.