Market Volume Imbalance
An arrow on the heatmap where aggressive volume tipped hard to one side — the V-Delta reading turned into events on the price.
Marks the price where aggressive volume tipped hard to one side. Same reading as the V-Delta band, drawn as an event on the field instead of a line.
- Heatmap
- any range
- Alerts
- yes
What it shows
An arrow on the heatmap each time aggressive flow tips hard to one side. Underneath is the same reading as V-Delta: aggressive buying minus aggressive selling, with older trades fading out. When that reading reaches the signal level you set, the indicator marks the moment on the price instead of leaving you to watch a line.
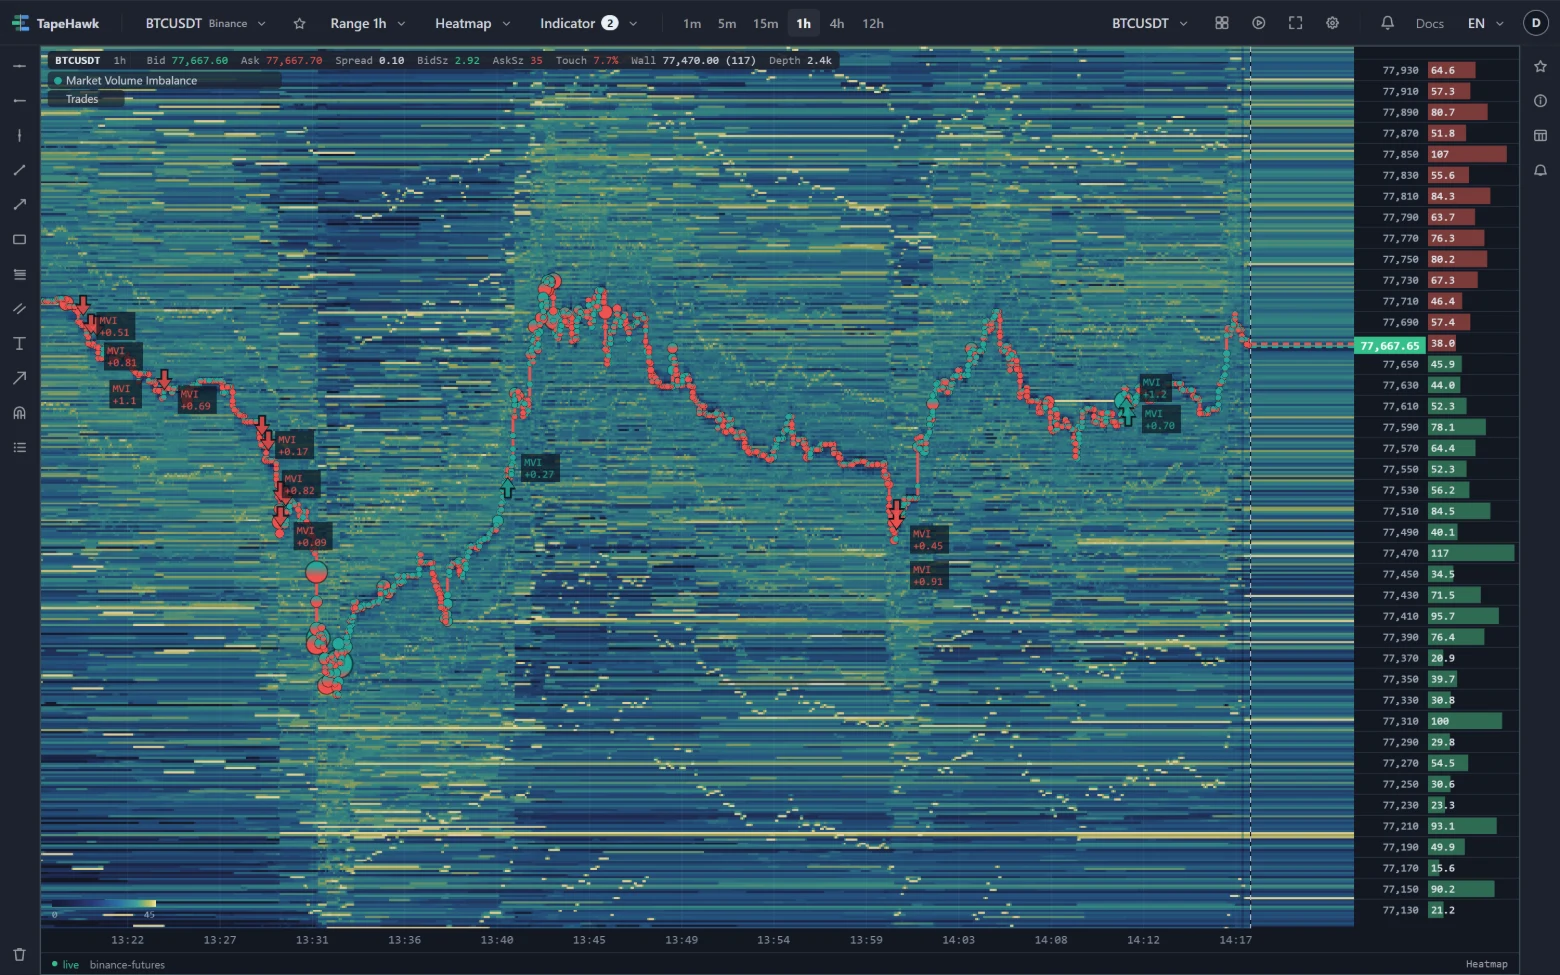
The arrow points up, from below the price, in the buying colour when buying tipped the flow; down, from above, in the selling colour for selling. A second, independent level has arrows with a notched tail. The plate prints the size of the trade the signal fired on, and can also print the price.
Figures, tooltip, held marks and history work as for every mark on the heatmap.
How to read it
- An arrow says the flow has leaned hard one way at that price. It points the way the aggression went, not the way to trade.
- Arrows repeating in one direction as price moves with them describe flow leading price. Arrows against a move that does not follow describe aggression being absorbed.
- The notched arrow belongs to the second level, so the two levels can be told apart at a glance.
- Held arrows, drawn as outlines, are ones the pullback rule below has held back — look at what it removed before deciding to hide them.
Parameters
| Setting | Control | What it does |
|---|---|---|
| Half-life | Choice 15 seconds · 30 seconds · 1 minute · 2 minutes · 5 minutes | The default is set by TapeHawk; the settings dialog shows it. |
| Units | Choice Volume · Share (%) | The default is set by TapeHawk; the settings dialog shows it. |
| Trigger | Choice On maximum · Immediately · After zero cross | The default is set by TapeHawk; the settings dialog shows it. |
| Signal level | Number | Range and default are set by TapeHawk; the settings dialog shows them. |
| Fall-back % | Number | Range and default are set by TapeHawk; the settings dialog shows them. |
| Second signal | On / off | The default is set by TapeHawk. |
| Trigger 2 | Choice On maximum · Immediately · After zero cross | The default is set by TapeHawk; the settings dialog shows it. |
| Signal level 2 | Number | Range and default are set by TapeHawk; the settings dialog shows them. |
| Fall-back % 2 | Number | Range and default are set by TapeHawk; the settings dialog shows them. |
| Pullback window | Number | Range and default are set by TapeHawk; the settings dialog shows them. |
| Pullback release | Number | Range and default are set by TapeHawk; the settings dialog shows them. |
| Max marks / minute | Number | At most this many marks in any one minute, so a burst stays readable — and since 02/09 the same number is the ceiling on how often an alert rule on either of this indicator's two signals may reach you. A rule takes THIS DEFAULT and keeps it: turning the knob on a panel changes the drawing only, because this knob is a DISPLAY setting and a rule inherits only what changes the numbers. The two can still differ at the edge of a busy minute, and the difference is deliberate: an alert is decided as each mark arrives and cannot be unsent, while the chart redraws the whole minute and lets a mark that was back-dated into it take a slot. How often the default bites here has not been measured — the 30-day figures exist for the three signals that were stored server-side (absorption 10.9%, stop hunts 21.2%, sweeps 3.0%) and this one was drawn in the browser. 1–30 · default 5 |
| Hide held marks | On / off | A held mark is one this indicator decided not to assert: it is drawn as an outline with no label and sends no alert. Here what holds a mark is the PULLBACK rule — a signal repeating the same way is held until the wait has passed, unless price has moved your way by enough. The outline shows you what that rule cost. Turn this on once you are satisfied and the outlines go; nothing is deleted, and turning it off puts every one of them back. |
| Label | Choice Mark only · Mark + size · Mark + size + price | How much each mark says on the chart. Mark only keeps the figures on hover, like the other signals. The other two print them beside the square. default: Mark + size |
| Buying colour | Colour | |
| Selling colour | Colour |
Half-life and Units set up the reading exactly as on V-Delta: how quickly trades fade, and whether the level is in the symbol's own volume or a percentage that means the same on any symbol.
Signal level is how far the reading must go. Trigger decides when reaching it becomes an arrow:
- On maximum follows the reading past the level and marks its peak once it has fallen back by Fall-back % — so the arrow lands a little in the past, on the moment it describes;
- Immediately marks the moment the level is reached, and waits for the reading to fall back by the fall-back before it can fire again;
- After zero cross waits for the reading to change sides first, then marks when it reaches the level.
Second signal turns on the second level, with its own Trigger 2, Signal level 2 and Fall-back % 2; it reads the same line.
Pullback window holds back an arrow that comes within that long of the last one shown, so one move does not print a column of arrows; Pullback release lets it through anyway once price has already moved in the last arrow's direction by that many price steps. Held arrows are drawn as outlines. Label sets how much each arrow prints: nothing beside the arrow, its short name and size, or its name, size and price.
Alerts
The Alert tab has two signals: signal for the first level and signal2 for the second.
Switch one on and TapeHawk tells you when it fires on this symbol, with the side, price and trade size. The alert uses the
settings on the Parameters tab at the moment you switch it on — the level included — and if you change them later, the
tab offers to bring the alert along. Held arrows send no alert, and an alert reaches you at most as often as the default
Max marks / minute allows. Alerts need a confirmed account; Signal alerts covers the rest.
Limitations
- In Volume units the level is an absolute amount, so one setting does not fit every symbol; Share (%) carries across symbols.
- A long half-life needs a long stretch of trading before the reading is ready, and no arrows fire until it is.
- With On maximum the arrow appears after the peak it marks, once the reading has fallen back.
- It is drawn on heatmap panels only, so only on symbols TapeHawk records, and it reaches back 24 hours.