Indicators
TEMA
The triple exponential moving average — a moving average with even less delay than DEMA, and more sensitivity to noise.
Triple exponential average — more lag cancellation than DEMA, more sensitive and noisier.
- Candles
- 1m, 3m, 5m, 15m, 30m, 1h, 2h, 4h, 6h, 12h, 1d, 1w, 1M
- Footprint
- 1m, 5m, 15m, 1h
- Alerts
- no
What it shows
A moving average that removes more of an EMA's delay than DEMA does. It combines an EMA, an EMA of that EMA and a third EMA on top, in the proportions that cancel most of the lag between them. The line follows price very closely.
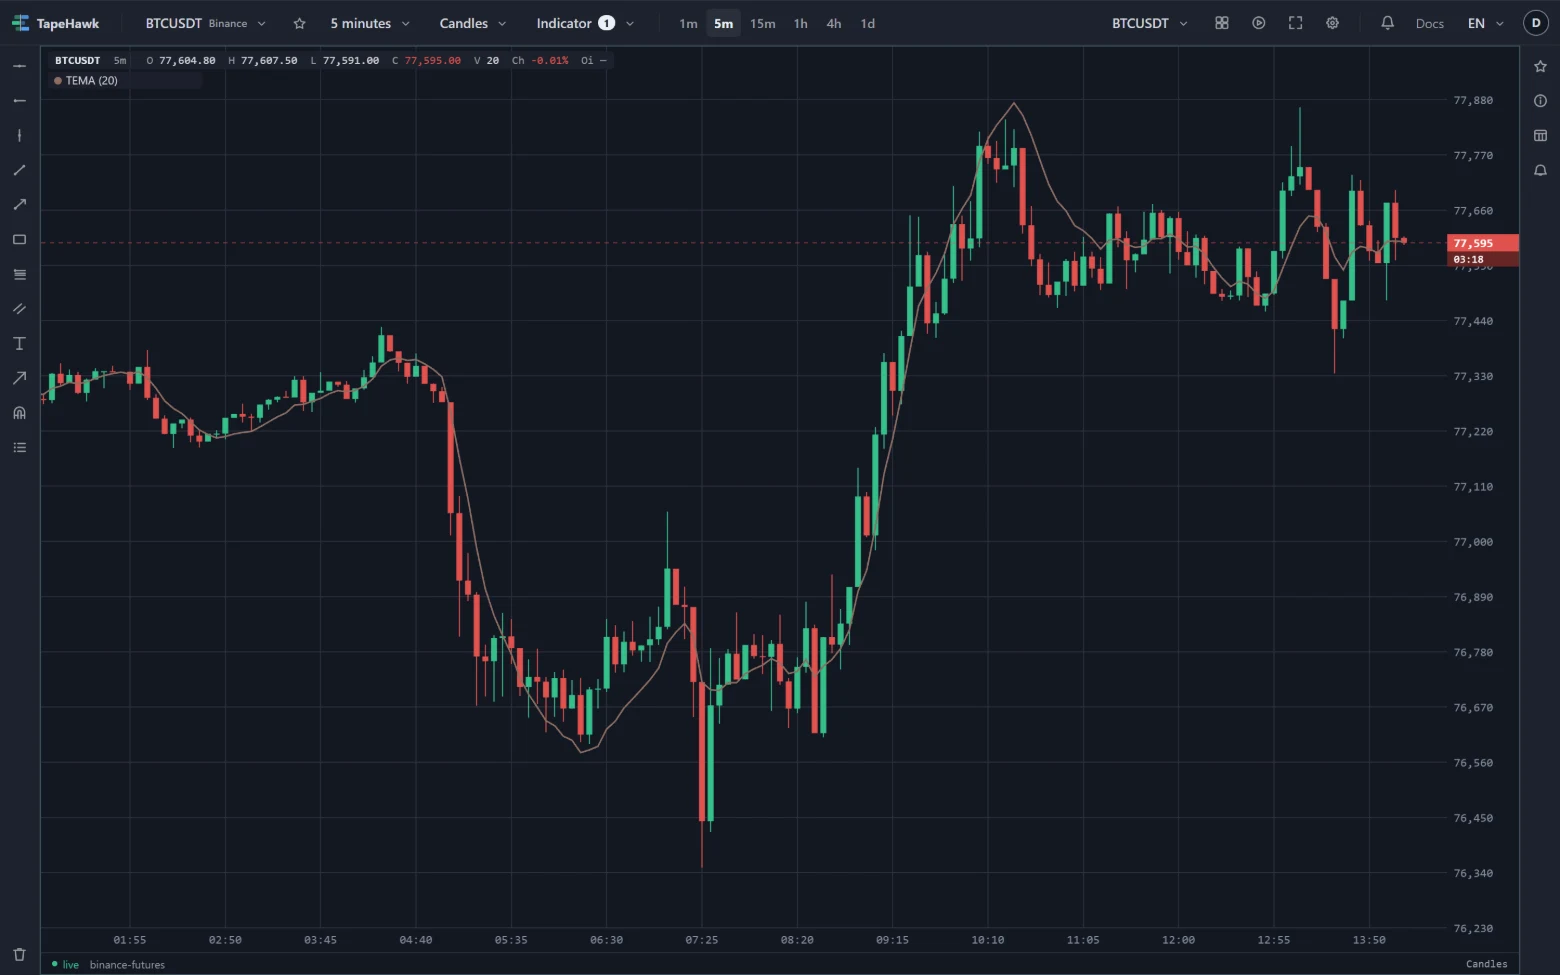
How to read it
- Slope. The TEMA turns with price almost at once, so its direction is a near-immediate read of the current swing.
- Price against the line. Price crosses a TEMA often. A close through it says less about the trend than a close through a slower average, and more about the last few candles.
- Pairs. A TEMA against a slower average — an EMA or SMA of a longer length — shows the short swing against the broader trend.
Parameters
| Setting | Control | What it does |
|---|---|---|
| Length | Number | How many candles go into the average. Larger is smoother and slower to react. Common: 20, 50, 200. 1–1000 · default 20 |
| Colour | Colour |
Length is counted in candles and is the length of each of the three EMAs inside it. Because a TEMA already removes most of the delay, a longer length is the way to calm it down without making it slow.
Limitations
- It is computed from the candles loaded on the panel. It needs about three times its length before the first value, because each average inside it waits for the one before. The first values also depend a little on where the loaded history begins, and settle after a few lengths.
- It is sensitive: in a choppy market it follows every wobble, and it runs past price at sharp turns more than DEMA does.
- The newest candle's close is the live price, so the last point of the line moves until that candle closes.
- It follows the candle shape: on Heikin Ashi it uses the real closes, and on Renko, range bars and line break the closes of the bricks and bars drawn — see Where an indicator can be drawn.
- It prints no value: read it against the price axis.
- It takes no alert. Its Alert tab says it draws no signal; for a price level, set a price alert.