Absorption Zones
Zones on a footprint panel where one side pushed through several levels and the bar then closed away — aggression that met resting size and failed, drawn as support or resistance.
Bands where several price levels in a row were imbalanced the same way AND the bar then closed away from them — aggression that met resting size and failed. Buying that got absorbed reads as resistance, selling that got absorbed as support: the opposite of what the same levels mean when nothing stops them.
- Footprint
- 1m, 5m, 15m, 1h
- Not drawn on
- Renko, Range bars, Line break — This chart type has no time axis, so order-flow indicators cannot be plotted on it
- Needs
- the instrument's price grid — without it the chart shows: “Instrument tick unknown — this indicator needs the exchange price grid”
- Alerts
- yes
What it shows
On a footprint panel, a shaded zone for every run of price levels inside a closed bar that were imbalanced the same way and that price then left: the bar closed far enough away from the run that the push clearly did not hold. That is aggression meeting resting size and failing — absorption.
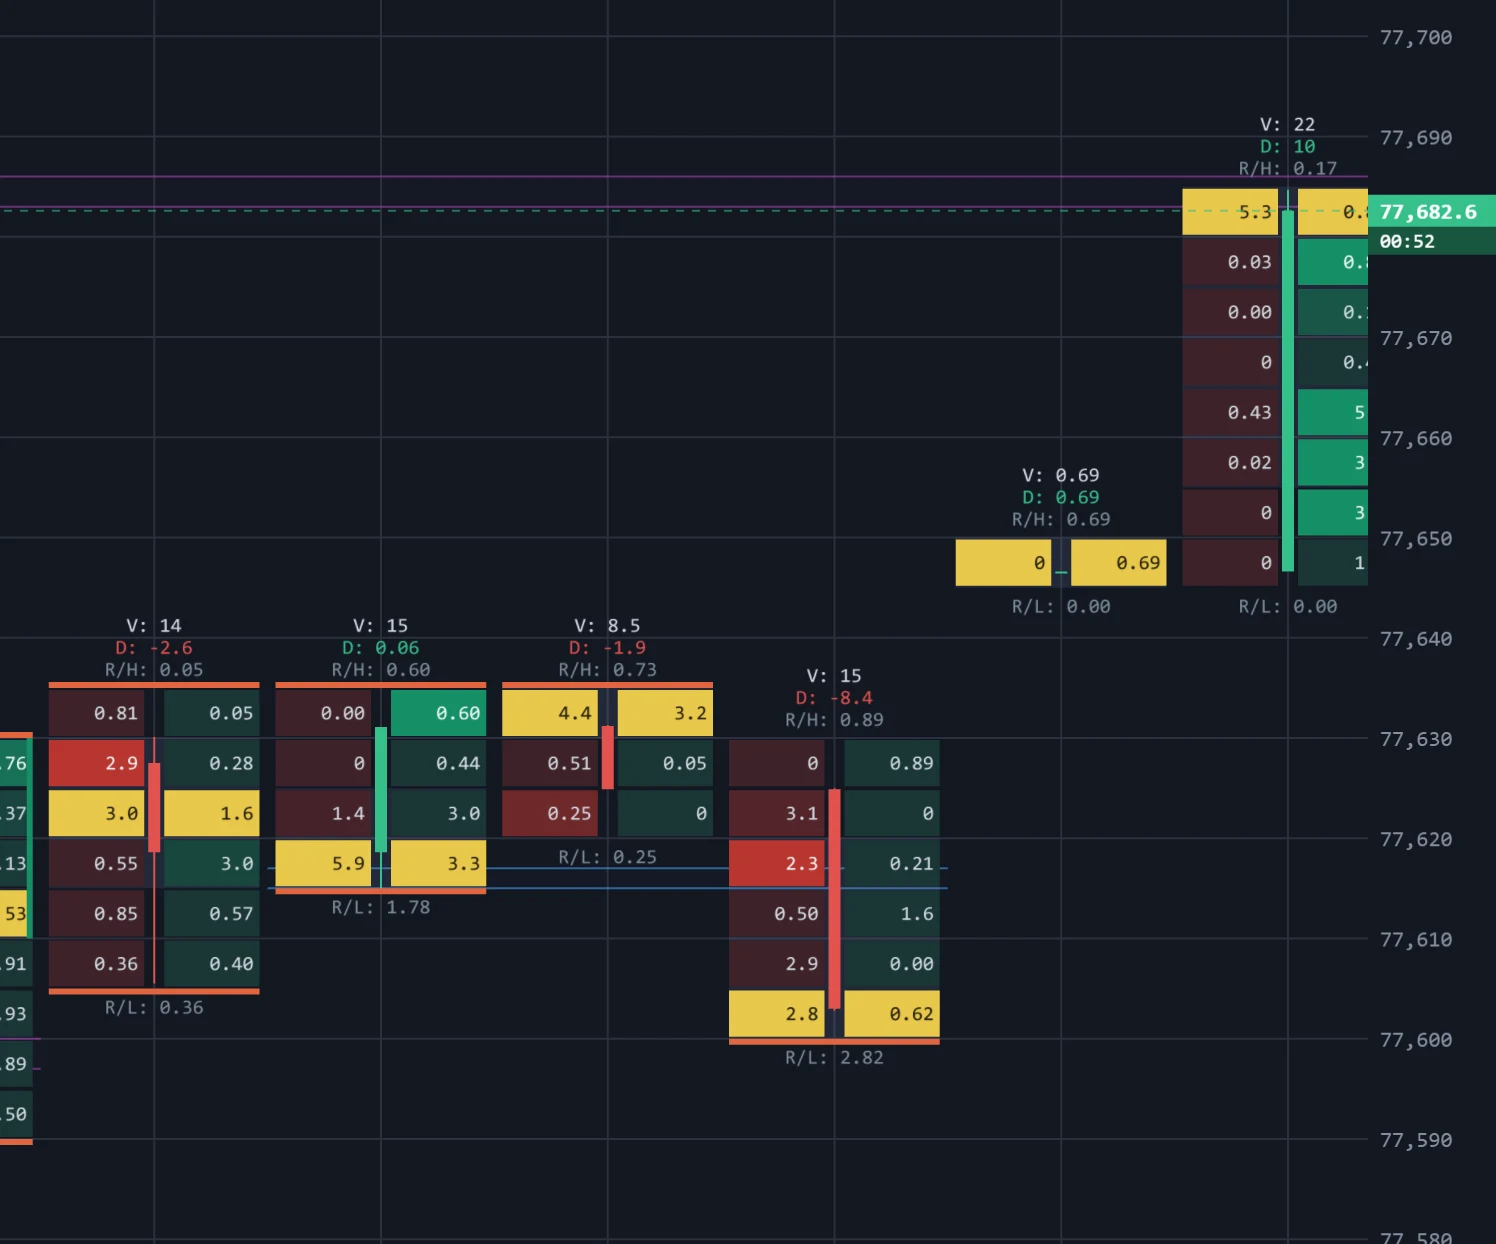
Because the push failed, the zone means the opposite of the same run on S/R Zones:
- Buying that was absorbed — a run of buying imbalance with the close below it — is drawn in the selling colour, as resistance: buyers pushed there and were refused.
- Selling that was absorbed — a run of selling imbalance with the close above it — is drawn in the buying colour, as support.
Each zone is drawn in two parts: a solid box on the bars that worked it, then a faint tinted band between the same two prices carrying it to the right, as far as the bar that ends it. A zone that has been ended stays on the chart between those two bars. The bar that made a zone never ends it.
How to read it
- A live resistance zone is a place where buyers already spent size and lost. Price returning there meets the sellers who absorbed them — or, if it breaks through, a level that has changed hands.
- A live support zone is the same reading from below.
- Next to S/R Zones, the two indicators split one kind of footprint evidence by what happened next: aggression that carried price with it, and aggression that did not.
Parameters
| Setting | Control | What it does |
|---|---|---|
| Price step (ticks) | Number | Range and default are set by TapeHawk; the settings dialog shows them. |
| Absorption, % | Number | Range and default are set by TapeHawk; the settings dialog shows them. |
| Bounce, ticks | Number | Range and default are set by TapeHawk; the settings dialog shows them. |
| Levels in a row | Number | Range and default are set by TapeHawk; the settings dialog shows them. |
| Hide rows under | Number | Range and default are set by TapeHawk; the settings dialog shows them. |
| Zone volume (% of bar) | Number | Range and default are set by TapeHawk; the settings dialog shows them. |
| Zone ends when | Choice a bar closes through it · price touches it · a wick goes through it | Which bar takes the band off the chart. A wick beyond the far edge is the vendor's default for absorption — a level price has already poked back through has been retested. The three rules nest: anything that closes through has already wicked through and already touched. default: a wick goes through it |
| Max marks / minute | Number | How many bands a minute may raise an alert. It bounds notifications only — every band the rule finds is still drawn. 1–60 · default 20 |
| Buying colour | Colour | |
| Selling colour | Colour |
Absorption, % is how much one side has to outweigh the other before a level counts, and Levels in a row how many such levels in a row make a zone. Bounce, ticks is the rejection test: how clearly the bar must have closed away from the run for the push to count as absorbed.
Price step (ticks), Hide rows under and Zone volume (% of bar) work as on S/R Zones: when Hide rows under and the footprint panel's Hide dust rows differ, the zones and the lit cells are measured over different rows.
Zone ends when picks the bar that takes a zone off the chart: the first to touch its near edge, the first to close beyond its far edge, or — the default here — the first to wick beyond its far edge. Max marks / minute concerns only alerts; it never limits the drawing.
Alerts
The Alert tab has one signal, zone. Switch it on and TapeHawk tells you when a
closed bar on this symbol makes an absorption zone, with the zone's price range and side. The rule watches bars of the
panel's timeframe — the same settings find different zones on 1m and 5m bars — so switch it on from a panel at the
timeframe you want. It uses the settings on the Parameters tab at the moment you switch it on; if you change them
later, the tab offers to bring the alert along. The alert comes once the bar has closed, since the test needs the
bar's close, and reaches you at most as often as the default Max marks / minute allows. Alerts
need a confirmed account; Signal alerts covers the rest.
Limitations
- It is drawn on footprint panels only, at 1m, 5m, 15m and 1h, and needs the symbol's price steps.
- Zones are found on closed bars — the test needs the bar's close — so the bar still forming has none yet.
- It reaches back 24 hours on a symbol TapeHawk records, and about half an hour on a live-only symbol.
- A panel draws a few hundred zones at most, so on a long history some are left out.
- The zones use their own settings, not the footprint panel's: if the two disagree, a zone can sit beside cells the footprint does not light.
S/R Zones
Support and resistance zones drawn on a footprint panel where a large amount of aggressive volume went through one band of prices, decisively on one side — the more it absorbed, the heavier the band.
Volume Spikes
A mark on the heatmap when a burst of trading goes through — a large amount in a short window, across several price levels — pointing the way of the side that traded more.