EMA
The exponential moving average — a line through the closing prices that counts recent candles more than older ones.
Exponential moving average — weights recent prices, so it tracks moves closer than SMA.
- Candles
- 1m, 3m, 5m, 15m, 30m, 1h, 2h, 4h, 6h, 12h, 1d, 1w, 1M
- Footprint
- 1m, 5m, 15m, 1h
- Alerts
- no
What it shows
A line through the average closing price of recent candles, drawn over the price. Each candle counts a little more than the one before it, and older candles fade out gradually instead of dropping off at a hard edge. That makes an EMA turn sooner after a move than an SMA of the same length.
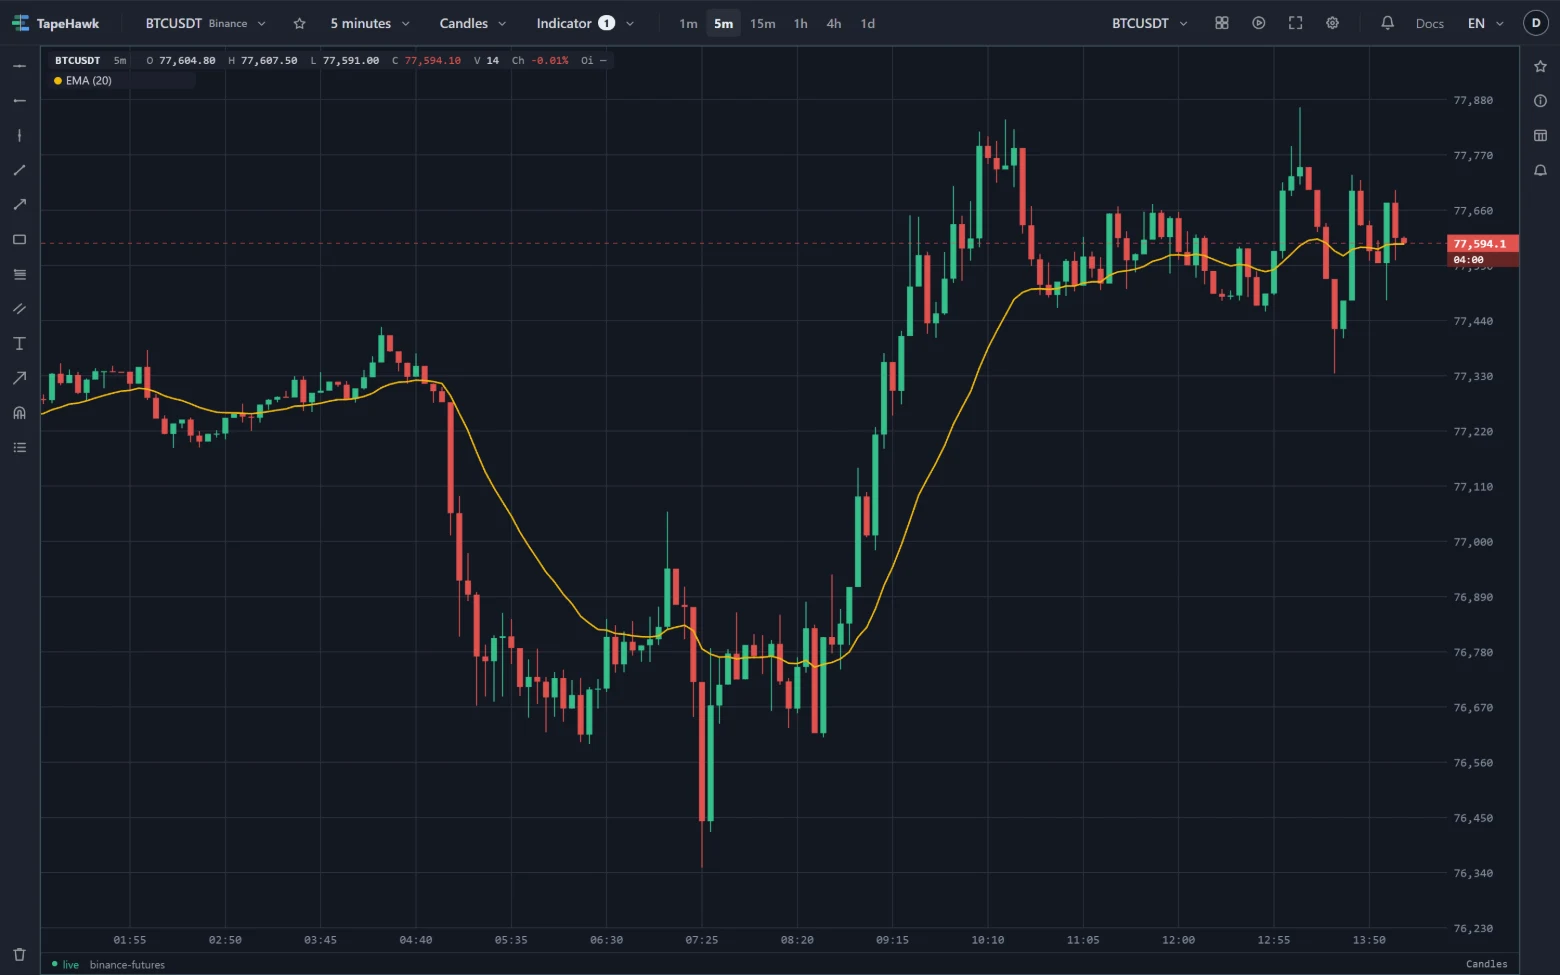
The info bar names each copy by its length — EMA (20) — so several EMAs on one panel stay apart.
How to read it
- Slope. A rising EMA means closes have been climbing over its length; a falling one, dropping. A flat EMA that price keeps crossing describes a market going sideways.
- Price against the line. Candles closing above a rising EMA describe an uptrend, and closes below a falling EMA a downtrend. A close through the line is the first sign the move may be turning.
- Two lengths. Add a second EMA with a longer length. The short one crossing above the long one means the recent average has moved above the older one — the usual sign a trend has turned up. Crossing below, down.
- Pullbacks. In a steady trend, pullbacks often pause near a widely used EMA such as 20, 50 or 200. Treat that as a place to watch, not a level that must hold.
Parameters
| Setting | Control | What it does |
|---|---|---|
| Length | Number | How many candles go into the average. Larger is smoother and slower to react. Common: 20, 50, 200. 1–1000 · default 20 |
| Colour | Colour |
Length is counted in candles, so the same number covers more time on a longer timeframe: an EMA of 20 spans 20 minutes on 1m and 20 days on 1d. A short length follows price closely and crosses it often; a long length shows the broader trend and reacts late. Give each copy its own colour so the lengths can be told apart on the chart.
Limitations
- It is computed from the candles loaded on the panel. The first candles of that history have no value until there are enough to fill the length. Because every earlier candle still carries a little weight, the values near the start of the loaded history can differ slightly from a chart that loaded more; they settle within a few lengths.
- The newest candle's close is the live price, so the last point of the line moves until that candle closes.
- It follows the candle shape: on Heikin Ashi it uses the real closes, and on Renko, range bars and line break the closes of the bricks and bars drawn — see Where an indicator can be drawn.
- It prints no value: read it against the price axis.
- It takes no alert. Its Alert tab says it draws no signal; for a price level, set a price alert.