Big Trade Profile
A horizontal histogram of where the large trades went, built from the individual executions above a size you set rather than from all the volume.
Where the large orders went, by price. Only prints above the size you set are counted, so a shelf built by a few big fills stands apart from one built by thousands of small ones — something the session profile folds together. Its window is the panel's own print log, not an anchored session.
- Heatmap
- any range
- Alerts
- no
What it shows
A horizontal histogram down the price axis, like the Volume Profile, built from only the trades above the size you set. Each row is how much of that large-trade volume happened at that price, split into the buying half and the selling half.
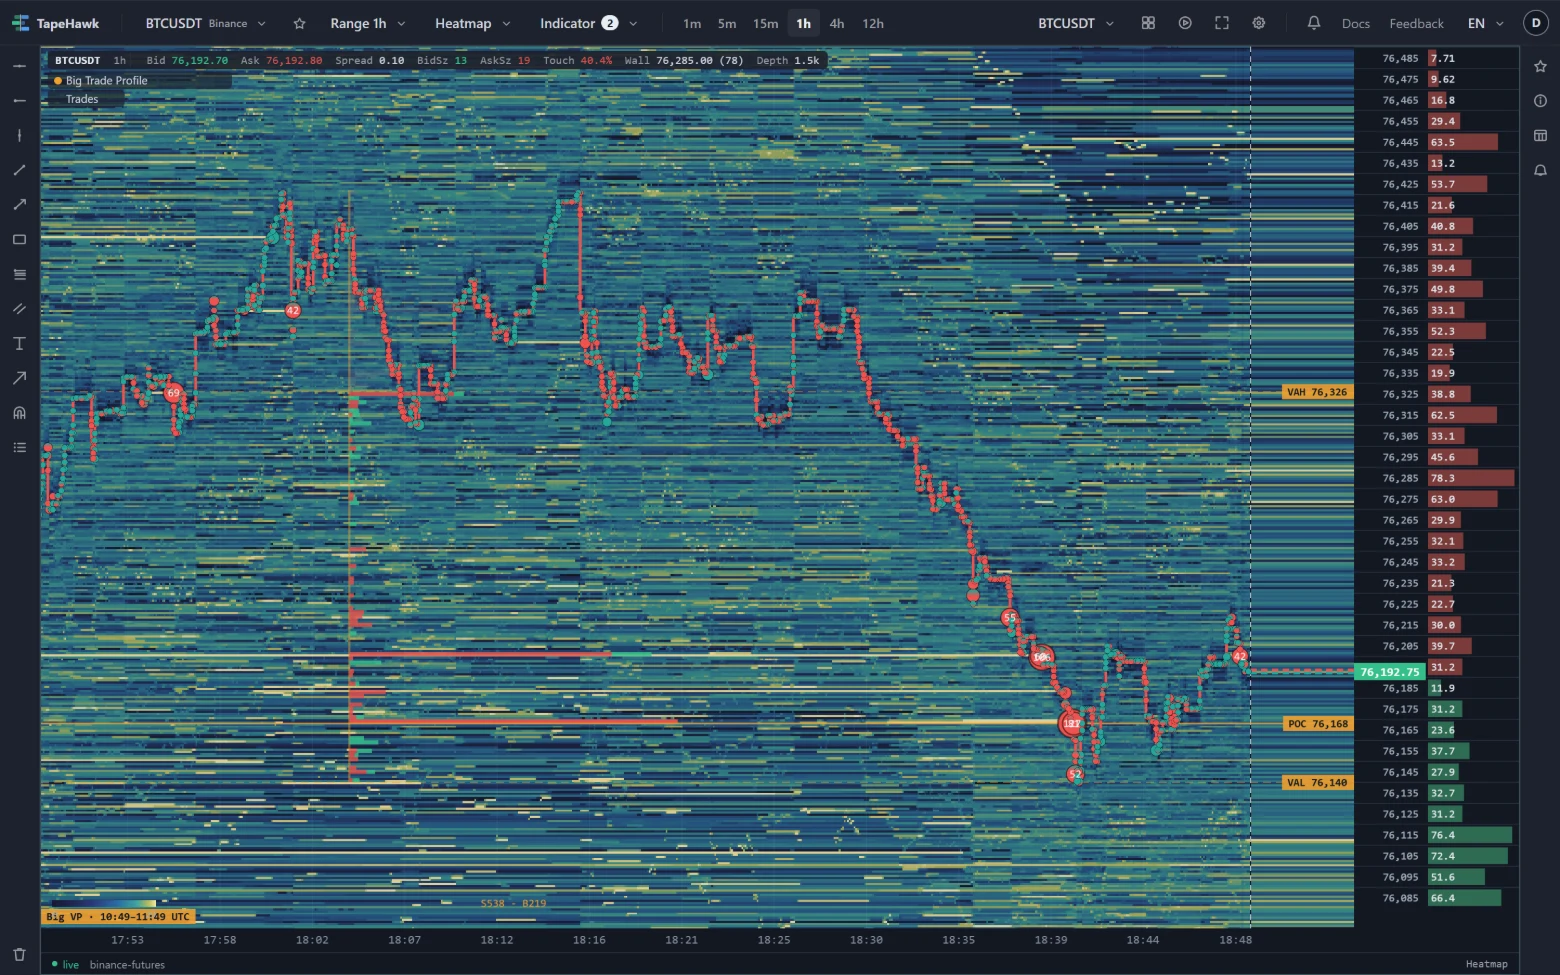
The session profile answers where volume traded. This one answers where the large orders went — and they are different facts. A shelf built by a few big fills and a shelf built by thousands of small ones fold into the same bar on a profile of everything; here only the first one draws.
It grows from the same edge as the Volume Profile but starts further across the panel, so the two can be read together without overlapping. Both colour their halves the same way on purpose — that is what makes them comparable — so it is the position and the amber labels that tell you which is which.
How to read it
- Against the session profile. Turn both on. Where the two agree, the crowd and the large orders bought the same prices. Where the amber histogram has a shelf the pink one does not, size arrived in a few decisions at a level ordinary volume passed through.
- The value area and the point of control are computed over the large trades alone, so its POC is the price the large money concentrated at — not the price the most contracts changed hands at.
- Sparse is correct. At a useful threshold this histogram is a handful of rows, not a wall. If it looks as full as the session profile, the threshold is too low to be selecting anything.
- Against Stop VP. That one profiles the volume that belonged to a cascade through several levels; this one profiles individual large executions. Three profiles on one panel fold onto the same rows and differ only in which volume they count.
Parameters
| Setting | Control | What it does |
|---|---|---|
| Minimum trade size ($) | Number | How large a single trade has to be before it counts, in quote currency. It is a notional figure rather than a size so that one number means the same thing on an expensive coin and a cheap one. This is an absolute number and it is per-market: measured over a day of tape, the value that picks out about fifteen of the largest trades an hour is around $450,000 on Binance BTCUSDT and $21,000 on BNBUSDT. The default is BTC's. 100–10000000 · default 100000 |
| Price step (ticks) | Number | How many venue ticks fold into one row. Larger means thicker rows and fewer of them. 1–1000 · default 20 |
| Value area (%) | Number | Share of volume counted into the value area around the POC. The industry standard is 70. 50–100 · default 70 |
| Show VAH / VAL | On / off | Draws the upper and lower edges of the value area (VAH and VAL). |
| Width (% of plot) | Number | How far the bars may reach across the plot, as a percentage of its width. They grow from the left edge. 5–40 · default 25 |
| Colour | Colour | |
| Bid bar colour | Colour | |
| Ask bar colour | Colour | |
| Position (% of plot) | Number | How far the histogram has slid from its home edge. 0 keeps it there — the left edge when the bars grow right, the right edge when they grow left; 100 pushes it to the far side. 0–100 · default 35 |
| Direction | Choice Grow left · Grow right | Which way the bars grow, and therefore which edge they start from. default: Grow right |
| Split buyers and sellers | On / off | Draws bid and ask beside each other instead of stacking them into one bar. |
| Show numbers | On / off | Prints the traded size at the head of each bar. Only rows above a tenth of the largest are labelled. |
| Summary labels | Choice Bid B / Ask S · Bid S / Ask B · Bid ▲ / Ask ▼ · Bid ▼ / Ask ▲ · None | What the summary badge calls the two sides. The letter styles name the order side; the arrows leave the reading to you. default: Bid S / Ask B |
| Volume filter (%) | Number | Hides rows smaller than this share of the biggest one. The POC and the value area are found before the filter runs, so they can never be filtered away. 0–50 · default 0 |
| High volume lines | On / off | Rules the busiest levels right across the chart. Off by default, because the POC and the value area edges are already drawn. |
| Top levels | Number | How many of the busiest levels get a line. 1–20 · default 3 |
| Opacity (%) | Number | Dims the whole profile. It multiplies the existing shading rather than replacing it, so the value area stays readable. 10–100 · default 100 |
Minimum trade size ($) is how large a single trade has to be before its volume is counted, in the quote currency — an amount of money rather than a number of coins, so one setting means the same thing on an expensive symbol and a cheap one. It is an absolute amount and it is per-symbol: a value that selects the top few trades an hour on BTCUSDT selects nothing on a cheaper symbol. It is the same setting Big Trades uses, and the two are worth setting alike — then one marks the trades and the other shows where they landed.
Price step (ticks), Value area (%), Width (% of plot), Position (% of plot) and the rest of the display settings behave exactly as they do on the Volume Profile.
Limitations
- Its window is the panel's own trade log, not a session. The chip at the bottom reports the stretch it actually folded, and that stretch follows the range you have open rather than an anchored day or block.
- It cannot be computed on the server. The stored per-minute totals have already added the trades together, so how big any individual one was is no longer in them — which is also exactly why this indicator can say something the session profile cannot.
- The threshold is an absolute amount, so one setting does not fit every symbol.
- It is drawn on heatmap panels only, so only on symbols TapeHawk records.
- The bars are trade size, while the threshold is money, so a row's height is directly comparable with the Volume Profile beside it even though the filter is not.
Stop Volume Profile
Where stops went off, by price — a horizontal histogram of the size that went through the book in runs across several price levels, on a heatmap.
TPO (Market Profile)
A letter for every period at each price that traded in it — the shape of each session, its TPO point of control, value area, initial balance and single prints.