ATR
The average true range — how far price typically moves in one candle, in price, in a band under the chart.
The average range a candle covers, in price. It measures volatility, never direction.
- Candles
- 1m, 3m, 5m, 15m, 30m, 1h, 2h, 4h, 6h, 12h, 1d, 1w, 1M
- Footprint
- 1m, 5m, 15m, 1h
- Alerts
- no
What it shows
A line in a band under the price plot, measuring volatility in the symbol's price. For each candle it takes the true range: the largest of the candle's high-to-low range and the distance from the previous close to this candle's high or low — so a gap between candles counts as movement. ATR is the smoothed average of the true range over the length.
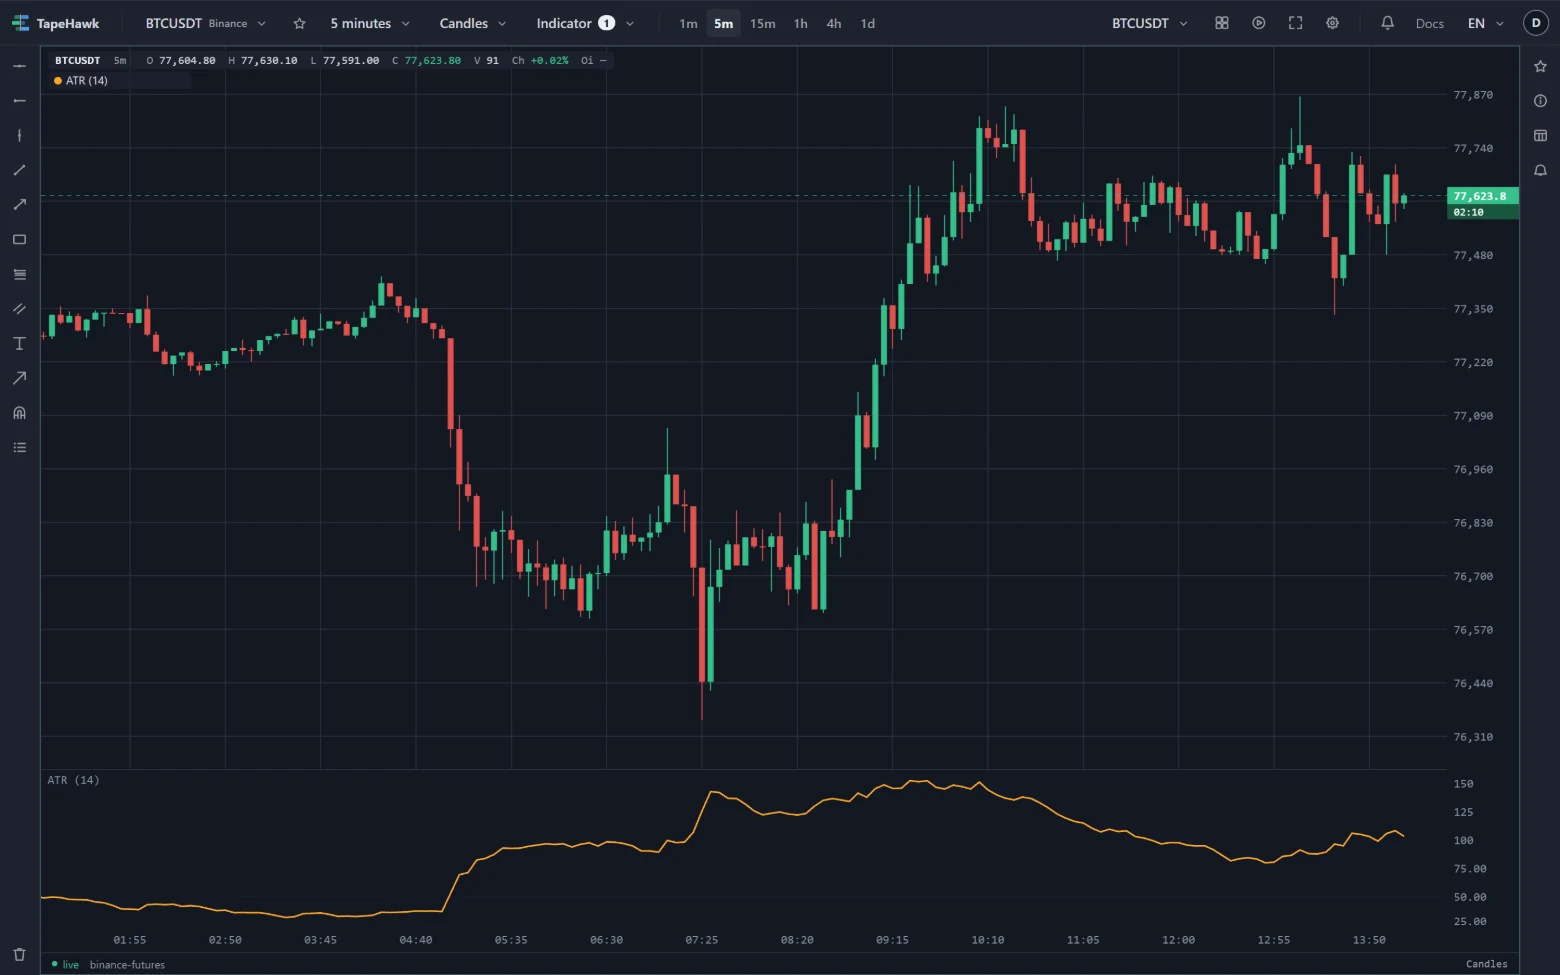
It says how much price moves, never which way. The band's name — ATR (14) — is followed by the value at the
candle under the pointer.
How to read it
- Rising ATR means candles are covering more ground: volatility is expanding, as it often does in breakouts and sell-offs.
- Falling ATR means candles are getting smaller: the market is quietening, as it often does before a larger move.
- Sizing stops and targets. A stop set at a multiple of ATR away from entry adapts to the market: wider when it is volatile, tighter when it is calm. Supertrend places its line the same way.
- Against price. ATR is in price units, so compare it with price itself: an ATR of 50 is a large move for a coin trading at 1,000 and a small one at 100,000.
Parameters
| Setting | Control | What it does |
|---|---|---|
| Length | Number | How many candles average the true range. Larger rides out a single shock. 2–200 · default 14 |
| Height (%) | Number | Height of the band, as a percentage of the panel. Dragging the band's edge changes it too. 8–50 · default 18 |
| Colour | Colour |
Length sets how many candles the true range is averaged over. A longer length rides out a single violent candle; a shorter one responds to it at once.
Height (%) is the band's share of the panel's height; dragging the band's top edge changes it too.
Limitations
- It is computed from the candles loaded on the panel. The first candles of that history have no value until there are enough for the length, and values near the start of the loaded history can differ slightly from a chart that loaded more; they settle after a few lengths.
- It has no direction. A rising ATR can come with a rally or a crash.
- The band's scale fits the values on screen, so the height of the line tells you about change within the view, not a level that compares across symbols.
- The newest candle is still trading, so the last value moves until that candle closes.
- It takes one of the panel's two band places — see Over the price, and in bands.
- It follows the candle shape: on Heikin Ashi it uses the real candles, and on Renko, range bars and line break the bricks and bars drawn — see Where an indicator can be drawn.
- It takes no alert. Its Alert tab says it draws no signal.