Liquidity Changes
Marks on the heatmap when one of the market's largest resting walls has stood for a while, and when a wall like that is pulled without being traded.
The market's largest resting walls, appearing and being withdrawn. The threshold is the book's own size quantile — nothing to set per market. A square when a wall has stood 30 seconds; a circle when a confirmed wall is pulled, and only when the tape does not explain the drop: a wall eaten by market orders stays silent here.
- Heatmap
- any range
- Alerts
- yes
What it shows
Marks on the heatmap for the life of the largest resting orders in the book:
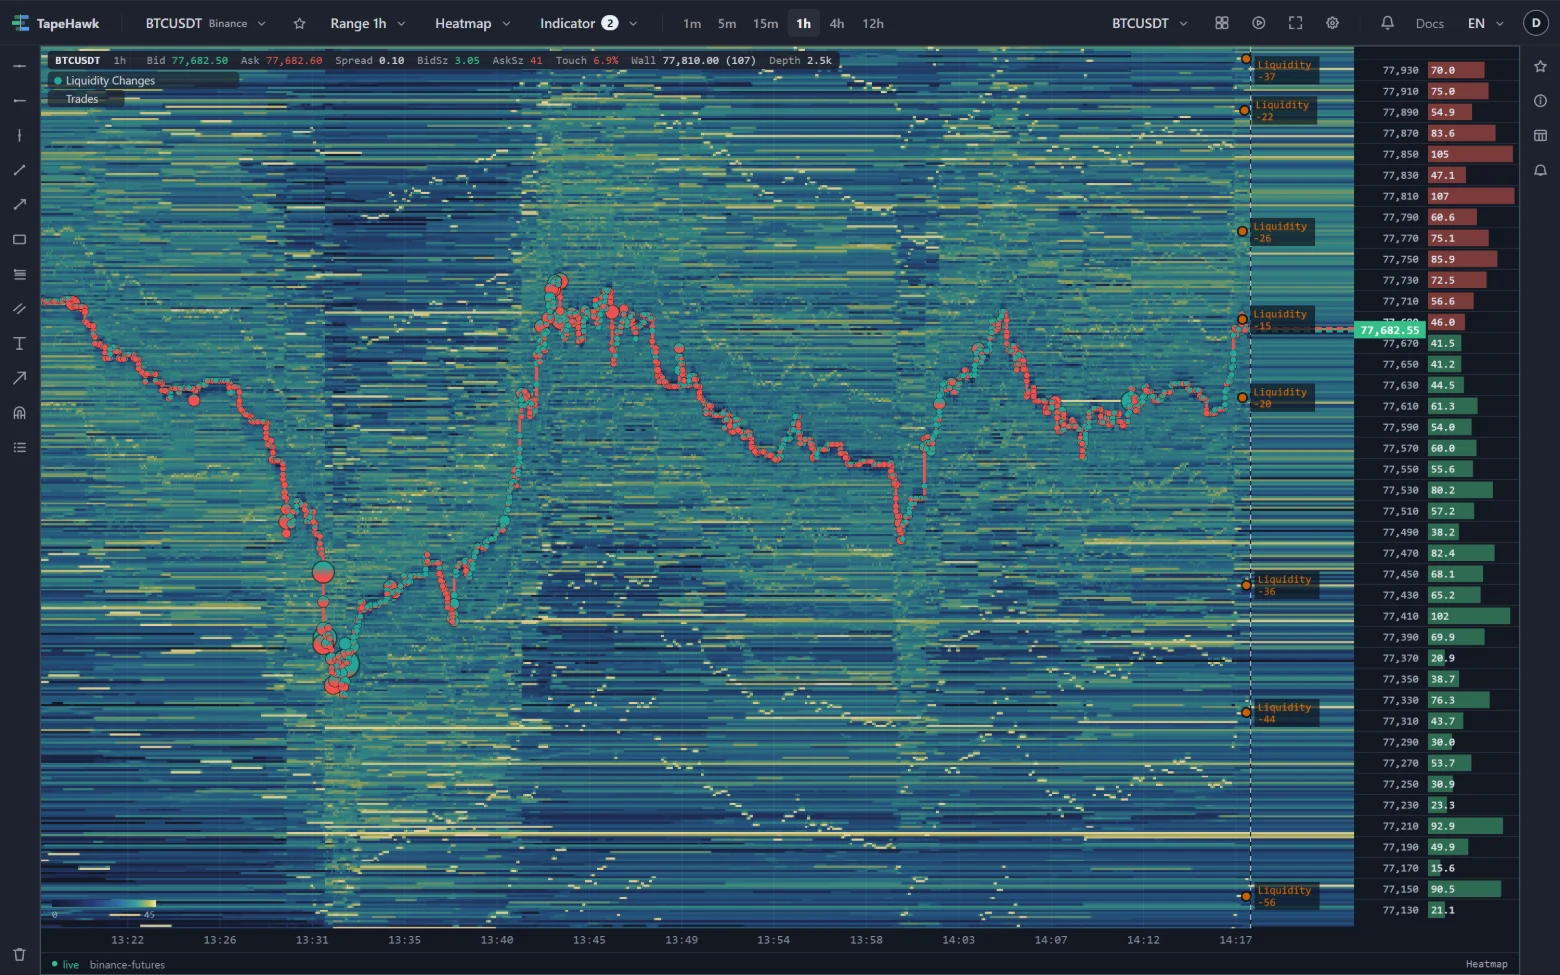
- a square in the added colour when a large wall has appeared and stood for a while — placed back at the moment it first appeared, so it sits at the start of the wall's band on the heatmap;
- a circle in the pulled colour when a wall that had stood is withdrawn — its size leaving the book without having been traded away.
What counts as large is decided by the book itself: the indicator keeps track of how big resting orders on this symbol usually are and only follows the very largest of them, so there is nothing to tune per symbol. A wall that is eaten by market orders stays silent here; that story belongs to trades and to Absorptions.
The plate beside a mark prints the size, with a plus for a wall that appeared and a minus for size withdrawn. Figures and tooltip work as for every mark on the heatmap.
How to read it
- A square is a large order that is committed enough to stay. It is a level other traders can see and react to — price often slows as it approaches.
- A circle is a large order that left before price got to it. A wall pulled as price approaches was never meant to be filled: it was shown, not offered. After a pull, the way past that price is thinner than it looked.
- Squares and circles at the same price repeatedly describe size being placed and removed there — often a sign of someone managing a level rather than trading at it.
Parameters
| Setting | Control | What it does |
|---|---|---|
| Only sizes at least | Number | A floor ON TOP of the automatic threshold, in the venue's own units — BTC here, contracts on a futures market — so it does not carry between instruments. 0 leaves the reading as the book itself sizes it, which is the point of this indicator; raise it when a market is busy enough that even its largest walls are common. It compares the SIZE either way: a floor of 5 keeps a 7 added and a 7 pulled. 0–100000 · default 0 |
| Added colour | Colour | |
| Pulled colour | Colour |
Only sizes at least adds a floor on top of the automatic threshold, in the symbol's own units, so it does not carry from one symbol to another. At 0, the default, the book alone decides what is large; raise it on a market busy enough that even its largest walls are common.
Alerts
The Alert tab has two signals: added for the squares and pulled for the circles. Switch
one on and TapeHawk tells you when that happens on this symbol, with the size and price. The alert is worked out by
TapeHawk on its own servers from the live book, independently of your panel — so it can fire for a wall your panel
did not mark, for example while the panel is closed. If TapeHawk is not running order-book alerts, switching one on
is refused with a message that says so. It uses the settings on the Parameters tab at the moment you switch it on; if you
change them later, the tab offers to bring the alert along. Alerts need a confirmed account; Signal alerts covers the rest.
Limitations
- It starts when the panel opens. The chart works this out in your browser from the live order book, and there is no recorded book to replay: nothing is marked to the left of that moment, and a page reload starts again.
- It reads the book as the exchange publishes it, several times a second and without order ids. A wall that lives for less than one update is never seen, and a pull is judged by how much of the drop the trades in between explain.
- A square comes only after the wall has stood long enough, so it appears a while after the moment it is placed at.
- A wall already standing when the panel opens is counted as having stood: it never gets a square, but it still gets a circle if it is pulled.
- It is drawn on heatmap panels only, so only on symbols TapeHawk records.
Book Imbalance
Which side of the resting order book near price is heavier, as a smoothed line under the heatmap, with a mark when the tilt passes a trigger and when it flips sides.
Market Volume Imbalance
An arrow on the heatmap where aggressive volume tipped hard to one side — the V-Delta reading turned into events on the price.