Volume
The volume each candle traded, drawn as columns along the foot of the price plot, coloured like the candle above.
Volume traded per candle, drawn as columns along the foot of the price plot.
- Candles
- 1m, 3m, 5m, 15m, 30m, 1h, 2h, 4h, 6h, 12h, 1d, 1w, 1M
- Footprint
- 1m, 5m, 15m, 1h
- Alerts
- no
What it shows
One column per candle along the bottom of the price plot, as tall as the volume that candle traded — in the symbol's own units, coins for a coin pair. The columns sit behind the candles, inside the price plot, so volume does not take one of the panel's two band places.
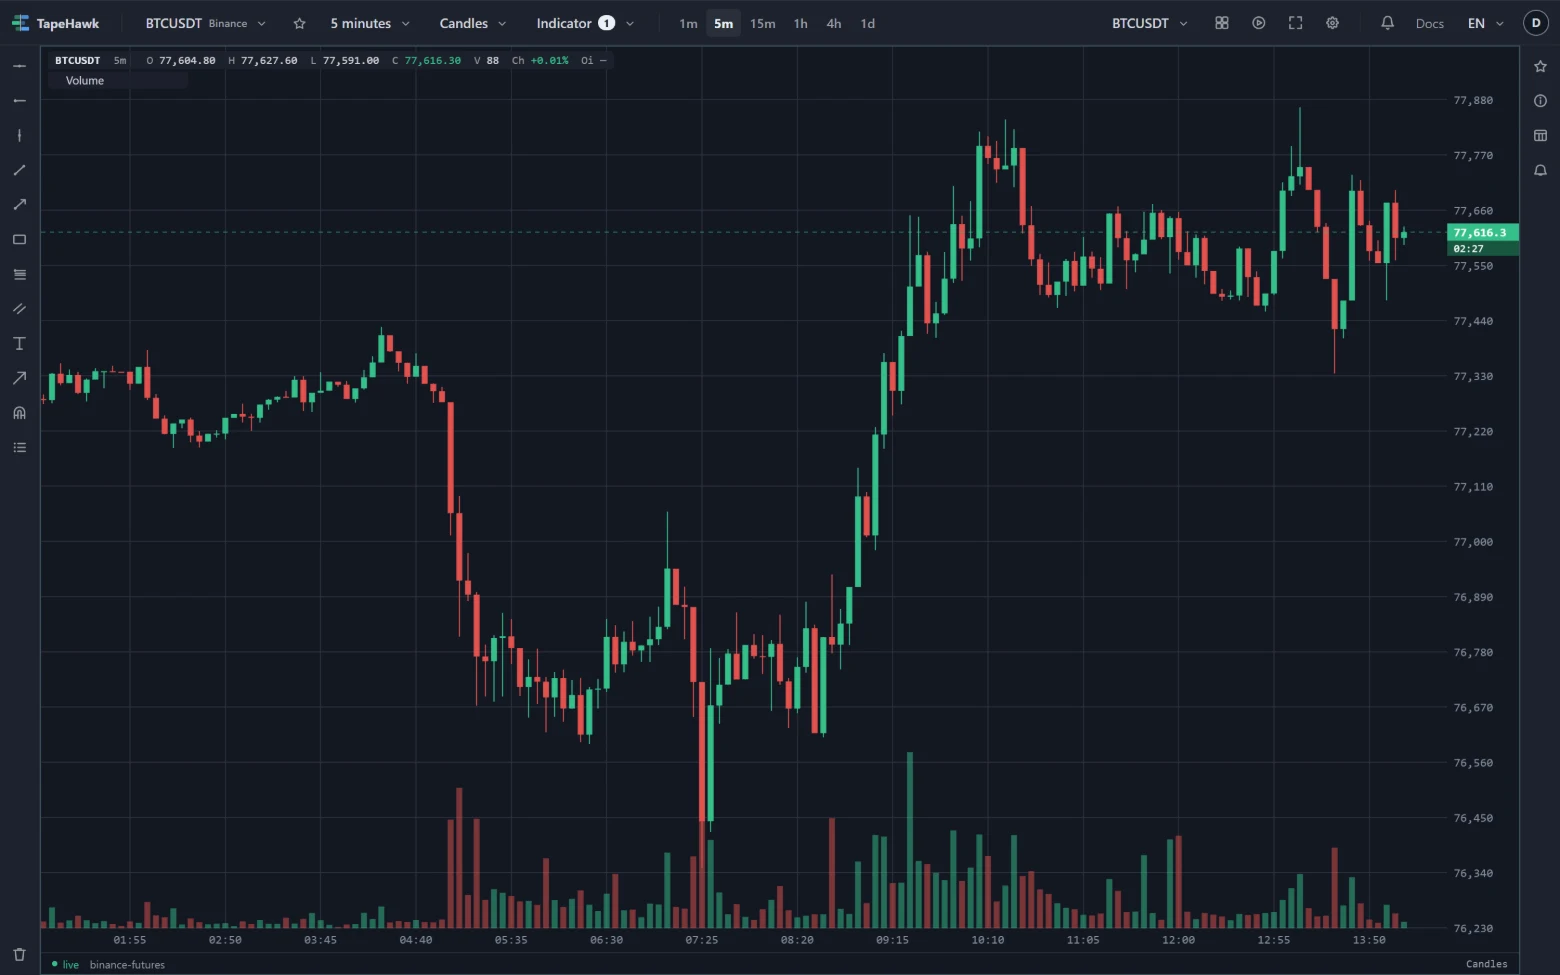
Each column takes the colour of the candle above it: the up colour when the candle closed at or above its open, the down colour when it closed below. On the line, area and step shapes, which have no candle bodies, every column takes the line colour.
The tallest column on screen reaches the full height set for the columns, and the others are scaled against it from zero.
How to read it
- Volume behind a move. A breakout or a trend leg on rising volume has participation behind it; the same move on thin volume is easier to reverse.
- Spikes. A single very tall column marks a candle where far more than usual traded — often a climax, a liquidation cascade or a news reaction. Where it happens relative to the move matters more than its height.
- Fading volume. Columns shrinking while price keeps going in one direction suggest the move is running out of participants.
- Colour says how the candle closed, not who was aggressive inside it. For buying against selling, use a footprint panel or the order-flow indicators.
Parameters
| Setting | Control | What it does |
|---|---|---|
| Height (%) | Number | How much of the price plot's height the volume columns may reach into. 5–40 · default 20 |
| Opacity (%) | Number | Opacity of the volume columns. Low sits them behind the candles, high brings them forward. 10–100 · default 50 |
Height (%) sets how far up the price plot the tallest column may reach. Keep it low enough that the columns stay clear of the candles you are reading. Opacity (%) sets how strongly the columns show: low values keep them in the background, high values bring them forward.
Limitations
- The columns have no scale and print no values; they show volume relative to the other candles on screen. The scale changes as you scroll or zoom, so the same column can look taller or shorter.
- The newest candle is still trading, so its column grows until the candle closes.
- On Heikin Ashi the columns follow the smoothed candles' colours, while the volume itself is each real candle's.
- On range bars the volume is exact, on Renko an estimate, and on line break partial — the indicator menu marks which. Candle shapes explains why.
- It takes no alert. Its Alert tab says it draws no signal.
Ichimoku Cloud
The Japanese five-line system — a fast and a slow line, a cloud projected ahead of price, and a lagging line — for trend, momentum and support at a glance.
RSI
The relative strength index — the strength of recent up closes against down closes, on a 0 to 100 scale, in a band under the price.