Ichimoku Cloud
The Japanese five-line system — a fast and a slow line, a cloud projected ahead of price, and a lagging line — for trend, momentum and support at a glance.
The Japanese five-line system: a fast and a slow line crossing for signals, and a cloud pushed ahead as support.
- Candles
- 1m, 3m, 5m, 15m, 30m, 1h, 2h, 4h, 6h, 12h, 1d, 1w, 1M
- Footprint
- 1m, 5m, 15m, 1h
- Not drawn on
- Renko, Range bars, Line break — This chart type has no time axis, so an indicator that plots into the future cannot be drawn on it
- Alerts
- no
What it shows
Five lines over the price, each built from the midpoint between the highest high and the lowest low of a stretch of candles:
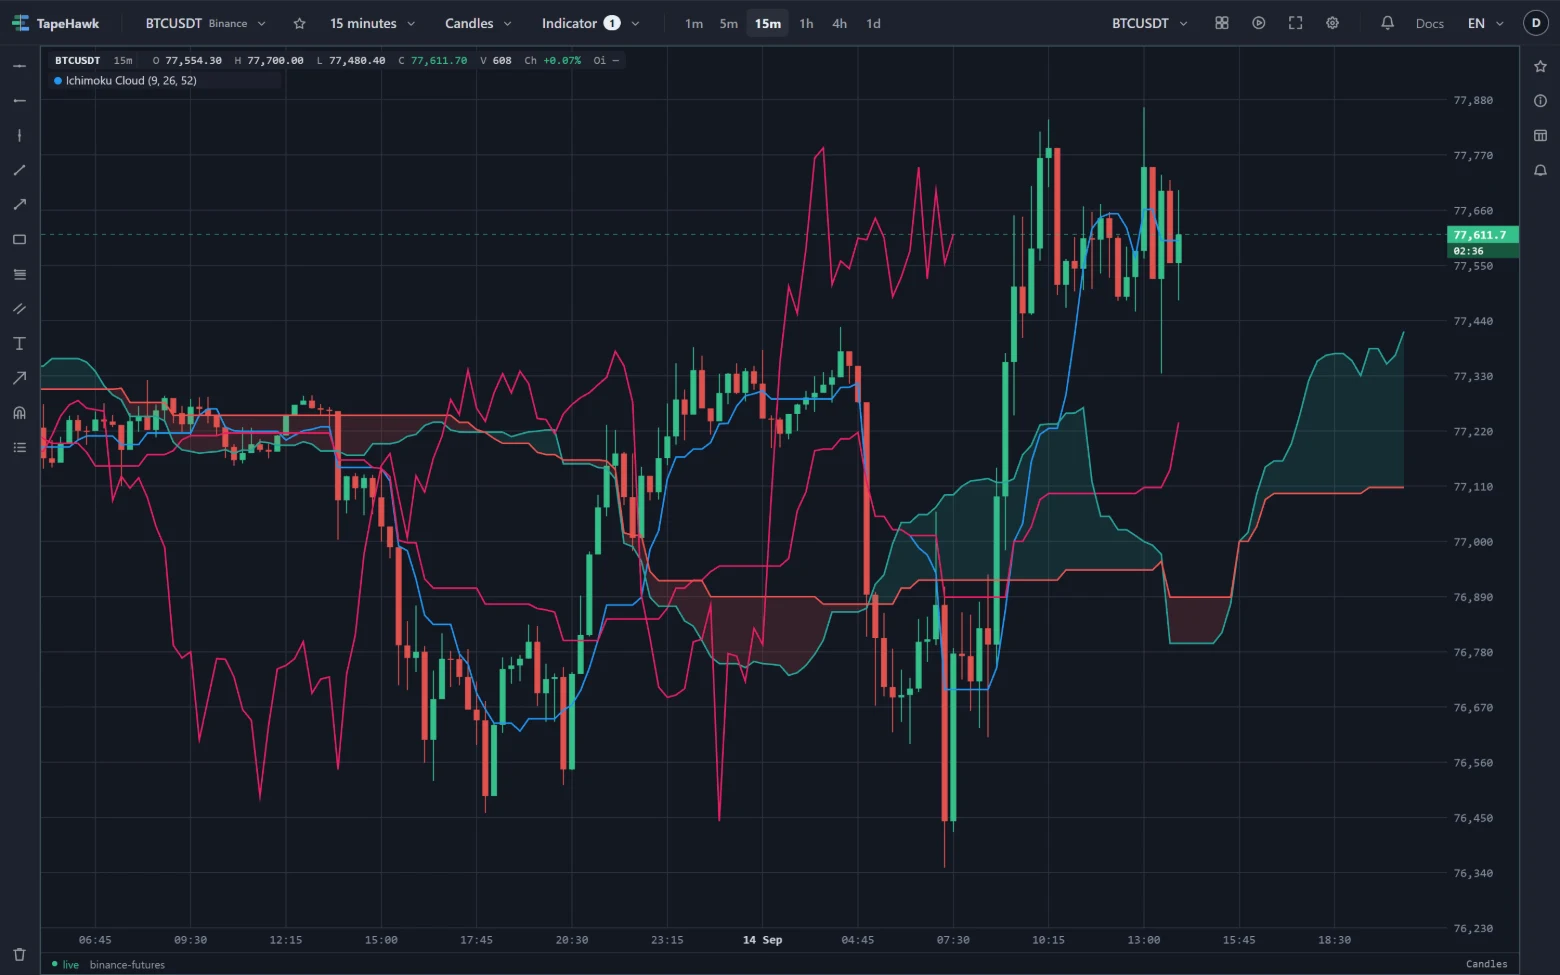
- Conversion line (Tenkan) — the midpoint over a short stretch. It follows price closely.
- Base line (Kijun) — the midpoint over a longer stretch. It is slower and flatter.
- Leading span A — halfway between the conversion and base lines, drawn ahead of price by the cloud displacement.
- Leading span B — the midpoint over the longest stretch, drawn ahead by the same displacement.
- Lagging span — the close, drawn back behind price by the same number of candles, in the base line's colour.
The space between the two leading spans is the cloud. It takes the bullish colour where span A is above span B and the bearish colour where it is below. Because both spans are pushed ahead, the cloud continues past the newest candle.
The info bar names it by its three lengths — Ichimoku Cloud (9, 26, 52).
How to read it
- Price and the cloud. Price above the cloud describes an uptrend, below it a downtrend, and inside it an undecided market. The cloud's edges often act as support and resistance.
- Cloud colour and thickness. A cloud in the bullish colour means the shorter midpoints are above the longest one. A thick cloud is a wide zone to break through; a thin one is easier to cross.
- Conversion and base lines. The conversion line crossing above the base line is the system's classic buy signal, and crossing below its sell signal. A cross above the cloud carries more weight than one inside or below it.
- The cloud ahead. The part past the newest candle is built from candles already on the chart, so it shows where the cloud will sit, not a forecast of price. A change of colour there shows the midpoints crossing.
- Lagging span. The close drawn back against the candles of that time: above them agrees with an uptrend, below them with a downtrend.
Parameters
| Setting | Control | What it does |
|---|---|---|
| Conversion line (Tenkan) | Number | The fastest line: midpoint of the last N candles' high and low. The Japanese standard is 9. 1–1000 · default 9 |
| Base line (Kijun) | Number | The base line, slower than Tenkan. Tenkan crossing above it is the classic signal. Standard 26. 1–1000 · default 26 |
| Leading span B | Number | The slow edge of the cloud. Larger makes it thicker and slower to turn. Standard 52. 1–1000 · default 52 |
| Cloud displacement | Number | How many candles the cloud is pushed to the right, projecting support ahead of price. Standard 26. 1–200 · default 26 |
| Conversion line colour | Colour | |
| Base line colour | Colour | |
| Bullish cloud colour | Colour | |
| Bearish cloud colour | Colour | |
| Fill opacity (%) | Number | Opacity of the shading between the lines. Set 0 to turn the fill off and keep the edges. 0–40 · default 15 |
The three lengths set the stretches the midpoints are taken over, from the conversion line's short one to span B's long one. Cloud displacement moves the cloud forward and the lagging span back by the same number of candles; it changes where they are drawn, not their values.
The defaults are the traditional values, set for markets that traded six days a week. Crypto trades every hour of every day, and some traders scale the lengths up to match; the chart accepts any values in the ranges shown.
Limitations
- It cannot be drawn on Renko, range bars or line break: those shapes have no time axis to project the cloud along.
- It is computed from the candles loaded on the panel. Each line starts once there are enough candles for its stretch, so span B appears last.
- The lagging span ends before the newest candle, by the displacement, since it is the close drawn back.
- The newest candle is still trading, so the latest points of every line — including the newest part of the cloud ahead — move until that candle closes.
- On Heikin Ashi it uses the real candles, not the smoothed ones — see Where an indicator can be drawn.
- It prints no values: read the lines against the price axis.
- It takes no alert. Its Alert tab says it draws no signal; for a price level, set a price alert.