Indicators
HMA
The Hull moving average — a moving average built to follow price with very little delay, at the cost of overshooting at turns.
Hull moving average — tracks closely with almost no lag, at the cost of overshooting at turns.
- Candles
- 1m, 3m, 5m, 15m, 30m, 1h, 2h, 4h, 6h, 12h, 1d, 1w, 1M
- Footprint
- 1m, 5m, 15m, 1h
- Alerts
- no
What it shows
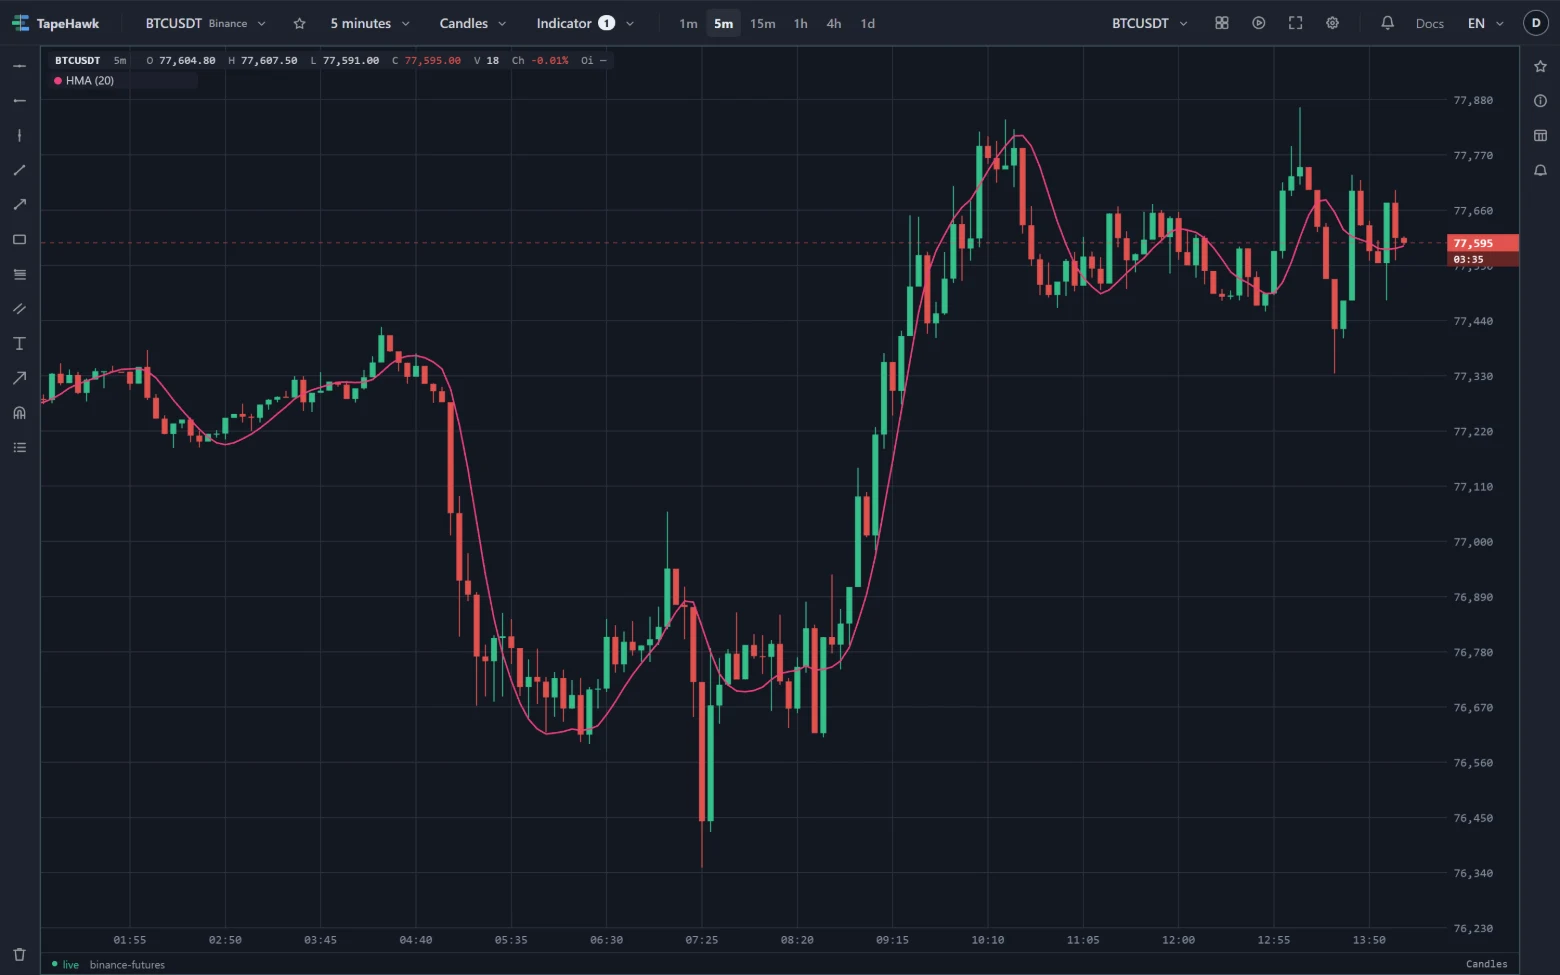
A moving average designed to stay close to price. It takes a weighted average over half the length, pushes it further in the direction it is already moving by comparing it with a weighted average over the full length, and then smooths the result over a short window. The line hugs price far more closely than an EMA or SMA of the same length while staying smooth.
How to read it
- Slope and turns. The HMA's main use is its direction. Because it lags so little, the point where it stops rising and starts falling — or the reverse — comes early, and many traders read that turn as the signal rather than a cross with price.
- Price against the line. Price stays near an HMA even in fast moves, so closes on the far side of it mean less than they do with a slower average.
- Overshoot. Pushing the average ahead of itself makes it run past price at a sharp turn and then come back. A short spike beyond the candles at a reversal is the HMA overshooting, not price.
Parameters
| Setting | Control | What it does |
|---|---|---|
| Length | Number | How many candles go into the average. Larger is smoother and slower to react. Common: 20, 50, 200. 1–1000 · default 20 |
| Colour | Colour |
Length is counted in candles. A longer length gives a smoother line that still turns relatively early; a short one reacts to almost every swing.
Limitations
- It is computed from the candles loaded on the panel. The first candles of that history have no value until there are enough for the full length and the smoothing after it.
- The newest candle's close is the live price, so the last part of the line moves until that candle closes — and because the HMA weights the newest candles heavily, it moves more than a slower average does.
- It follows the candle shape: on Heikin Ashi it uses the real closes, and on Renko, range bars and line break the closes of the bricks and bars drawn — see Where an indicator can be drawn.
- It prints no value: read it against the price axis.
- It takes no alert. Its Alert tab says it draws no signal; for a price level, set a price alert.