Book Imbalance
Which side of the resting order book near price is heavier, as a smoothed line under the heatmap, with a mark when the tilt passes a trigger and when it flips sides.
Which side of the resting book is heavier, with the reference platform's two signals: a triangle when the tilt passes the trigger, and a zero-cross when it flips sides and confirms.
- Heatmap
- any range
- Alerts
- yes
What it shows
A line in a band under a heatmap that compares the resting size on the two sides of the order book, over a range of price levels near the current price. Above zero, more size is resting on the bid; below zero, on the ask. The reading is a percentage, smoothed over time so that one large order appearing and vanishing does not throw it about.
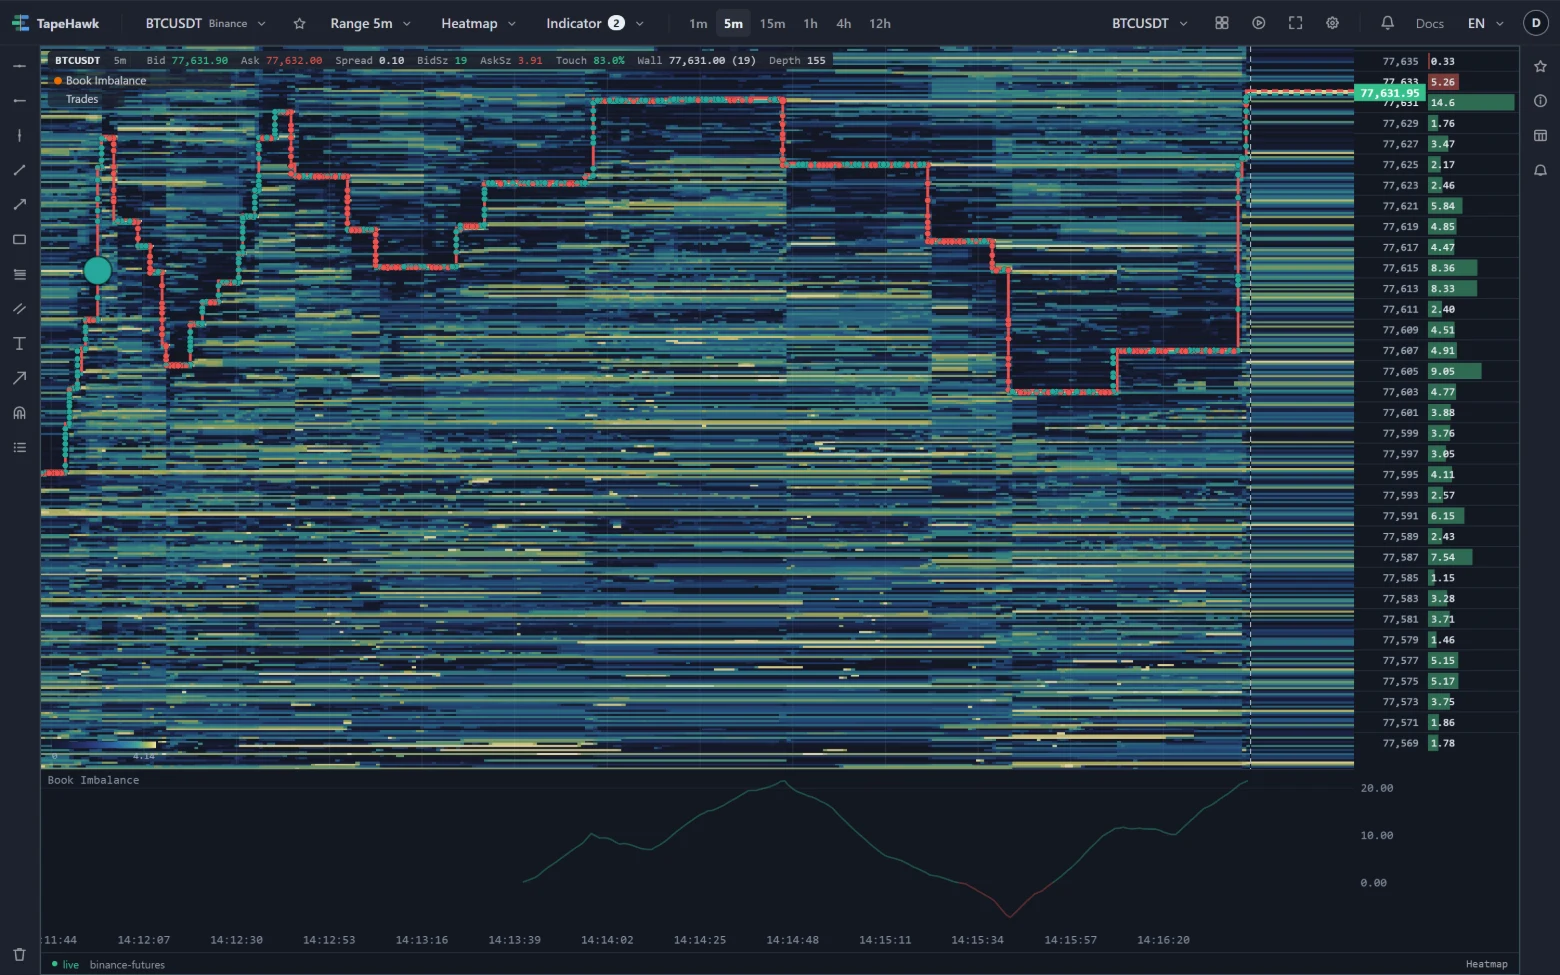
The line takes the up colour above zero and the down colour below. Dashed lines across the band mark the trigger level on either side, while the band's scale reaches them.
It adds two kinds of mark to the heatmap:
- a triangle when the tilt reaches the trigger — pointing up, from below, in the buying colour when the bid side got heavy; pointing down, from above, in the selling colour when the ask side did;
- a circle when the tilt flips from one side to the other and carries on far enough past zero to confirm it.
The plate beside a mark prints the reading at that moment. Figures and tooltip work as for every mark on the heatmap.
How to read it
- A heavy bid under price is resting demand; a heavy ask above it is resting supply. The line says which side of the nearby book is thicker right now — not which side is trading.
- A triangle marks the moment one side became clearly heavier. Watch whether price leans towards the thin side, and whether the heavy side is still there when price arrives, or is pulled.
- A circle marks the book changing its lean, which often comes before price turns — or shows resting size moving out of the way.
- Resting orders can be cancelled at any time, so a heavy side is a picture of intent, not a commitment. Compare with the heatmap itself, and with Liquidity Changes for walls being pulled.
Parameters
| Setting | Control | What it does |
|---|---|---|
| DOM from (ticks) | Number | The NEAR edge of the range, in venue ticks from the current price. 0 includes the touch itself; 1 starts one tick away, which is the reference platform's own example. Raising it excludes the quotes nearest the spread, where size appears and vanishes fastest. 0–4000 · default 1 |
| DOM to (ticks) | Number | The FAR edge, in venue ticks. The reference platform's example is 1 to 60. A range wider than the book selects the whole book and stops; an inverted pair selects nothing. 1–4000 · default 60 |
| Weight by depth | On / off | Counts a near level for more than a far one: the eighth counts half, the sixteenth a quarter. By level index rather than by price distance, so the same book reads the same on a tick-dense instrument and a coarse one. |
| Half-life | Choice 15 seconds · 30 seconds · 1 minute · 2 minutes · 5 minutes | How fast an older reading fades. One large order arriving and cancelling moves an instantaneous book reading by tens of per cent; the window is what removes that. The reference platform's own painter runs 60 seconds. default: 1 minute |
| Trigger (%) | Number | How far the book has to tilt before a triangle is drawn. The reference platform's own example is 20. Unlike the liquidity thresholds this one transfers between markets: it is a percentage of a quantity that is already normalised, so 20 means the same thing on BTC and on a thin alt. A mark is drawn when the reading REACHES the trigger, not for as long as it stays there. 1–100 · default 20 |
| Confirm after (%) | Number | How far past zero the tilt has to reach before a cross counts. The reference platform's page says a threshold after the baseline is needed so a volatile market does not fire on every wobble; a tilt that touches zero and turns straight back does not fire here either. 0 fires on the bare crossing, which is what the threshold exists to avoid. 0–100 · default 5 |
| Height (%) | Number | Height of the band, as a percentage of the panel. Dragging the band's edge changes it too. 8–50 · default 18 |
| Max marks / minute | Number | At most this many marks in any one minute, so a burst stays readable — and the same number is the ceiling on how often an alert rule on this signal may reach you. A rule takes this default and keeps it: turning the knob on a panel changes the drawing only. 1–30 · default 5 |
| Colour | Colour | |
| Buying colour | Colour | |
| Selling colour | Colour |
DOM from (ticks) and DOM to (ticks) choose the price levels that are compared, counted in the exchange's price steps away from the current price. Starting a little away from the price leaves out the levels nearest the spread, where size appears and vanishes fastest. Weight by depth counts nearer levels for more than farther ones. Half-life sets how quickly an old reading fades from the average.
Trigger (%) is how far the tilt must go for a triangle. Unlike the size triggers of other order-flow indicators it is a percentage, so it means the same on any symbol. A triangle comes when the tilt reaches the trigger, not for as long as it stays beyond it. Confirm after (%) is how far past zero the tilt must reach before a flip counts, so a reading that only touches zero and turns back does not mark.
Alerts
The Alert tab has two signals: tilt for the triangles and zerocross for the circles.
Switch one on and TapeHawk tells you when that signal fires on this symbol. The alert is worked out by TapeHawk on its
own servers from the live book, independently of your panel — so it can fire for a moment your panel did not draw, for
example while the panel is closed. If TapeHawk is not running order-book alerts, switching one on is refused with a
message that says so. It uses the settings on the Parameters tab at the moment you switch it on; if you change them later,
the tab offers to bring the alert along. An alert reaches you at most as often as the default
Max marks / minute allows. Alerts need a confirmed account; Signal alerts covers the rest.
Limitations
- It starts when the panel opens. The chart works this out in your browser from the live order book, and there is no recorded book to replay: to the left of that moment the band is empty, and a page reload starts it again.
- The first stretch is drawn faded while the average fills up, and no marks appear until it has.
- It reads the book as the exchange publishes it, several times a second and without order ids: a wall that lives for less than one update is never seen.
- It is drawn on heatmap panels only, so only on symbols TapeHawk records.
- It takes one of the panel's two band places — see Over the price, and in bands.
Stop Runs
A mark on the heatmap where several aggressive orders in a row pushed the same way, each starting where the last one stopped — the shape a cascade of stops leaves.
Liquidity Changes
Marks on the heatmap when one of the market's largest resting walls has stood for a while, and when a wall like that is pulled without being traded.