Stop Volume
Size that went through the book in runs across several price levels — the shape stop orders leave — buy side against sell side, fading out, with a mark when a cluster finishes.
Size going off as stop orders, buy side against sell side, with older bursts fading out. A spike stands straight up and then melts, so it reads a cluster firing now rather than a session total.
- Heatmap
- any range
- Alerts
- yes
What it shows
A line in a band under a heatmap that tracks size going off as stops. The exchange does not say which trades were stop orders, so TapeHawk looks for the shape a stop cascade leaves on the tape: one aggressive run that pushes through several price levels in a single motion. The line weighs recent buying runs of that kind against recent selling runs, with older ones fading out, so it stands straight up when a cluster fires and then melts back.
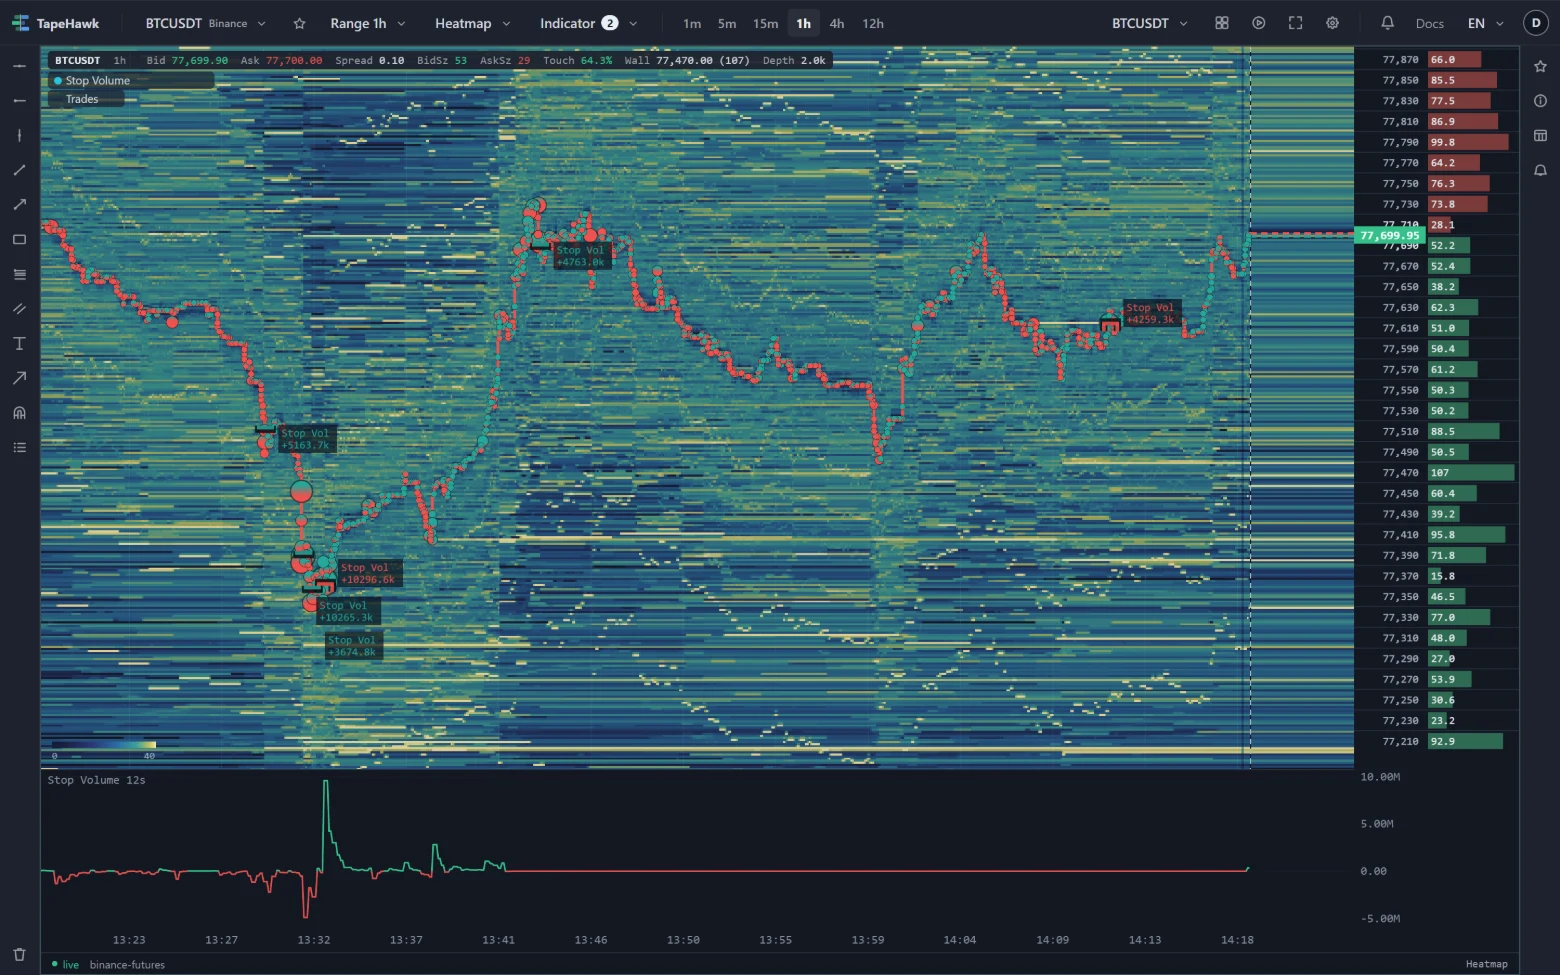
Above zero the line takes the up colour, below zero the down colour.
When the line swings far enough and then falls back from its peak, the cluster is treated as finished and a
bracket is placed on the heatmap at the peak's price and moment — a bar with two legs turning away from the
price, like the shelf the stops were sitting on. By default a buy-stop bracket is red and a sell-stop bracket
green, the reverse of the other marks; the tooltip names the side as stopBuy or stopSell. Plates, held marks and history work as for every mark on the heatmap.
How to read it
- Spikes on the line mark stop clusters going off right now; the height is how much size was forced through.
- Brackets mark the end of a cluster. Stops that have all fired can leave the move without fuel, so price near a fresh bracket is worth watching for a stall or a turn — and for the opposite: a move that keeps going after its stops are spent.
- One side dominating for a while — spikes only above zero, say — describes a market squeezing one side's positions again and again.
Parameters
| Setting | Control | What it does |
|---|---|---|
| Price range (levels) | Number | Range and default are set by TapeHawk; the settings dialog shows them. |
| Gap (ms) | Number | Range and default are set by TapeHawk; the settings dialog shows them. |
| Half-life (ms) | Number | Range and default are set by TapeHawk; the settings dialog shows them. |
| Signal level (M) | Number | Range and default are set by TapeHawk; the settings dialog shows them. |
| Signal level max (M) | Number | Range and default are set by TapeHawk; the settings dialog shows them. |
| Fall-back % | Number | Range and default are set by TapeHawk; the settings dialog shows them. |
| Hold back marks the flow contradicts | On / off | The default is set by TapeHawk. |
| Hide held marks | On / off | A held mark is one this indicator decided not to assert: it is drawn as an outline with no label and sends no alert. The outline is there so you can judge the filter rather than trust it — you see the exhausted clusters it held back. Turn this on once you are satisfied and the outlines go; nothing is deleted, and turning it off puts every one of them back in the same frame. |
| Max marks / minute | Number | At most this many marks in any one minute, so a burst stays readable — and since 02/09 the same number is the ceiling on how often an alert rule on this signal may reach you. It is a ceiling on noise, not the thing that stops one spike being reported twice: this indicator will not re-arm until the line has left signal territory altogether, which is a rule rather than a ceiling. 1–30 · default 5 |
| Buy-stop marker colour | Colour | |
| Sell-stop marker colour | Colour | |
| Height (%) | Number | Height of the band, as a percentage of the panel. Dragging the band's edge changes it too. 8–50 · default 18 |
| Colour | Colour |
Price range (levels) and Gap (ms) decide what counts as one run through the book: how many price levels it must cross, and how long a pause ends it. Half-life (ms) sets how quickly the totals fade.
Signal level (M) is the swing a cluster needs before it can earn a bracket, in millions of the quote currency. It is an absolute amount with a default sized for BTCUSDT, so smaller symbols need less. Signal level max (M) can leave out clusters that start out larger than a size; it is checked as the line first becomes a candidate, so a cluster that grows past it afterwards is still marked. Fall-back % decides how clearly the swing must be over before the cluster counts as finished; the bracket is placed at the peak either way.
Alerts
Each side is a signal of its own in the Alert tab: stopBuy for buy-stop
clusters and stopSell for sell-stop clusters. Switch one on and TapeHawk tells you when a cluster on that side
finishes. The alert watches the settings on the Parameters tab when you switch it on; if you change them later,
the tab offers to bring the alert along. Held marks send no alert. Alerts need a confirmed account; Signal alerts covers the rest.
Limitations
- The exchange does not label stop orders: what this counts is runs shaped like stop cascades, which also catches ordinary aggressive orders that crossed several levels.
- It is drawn on heatmap panels only, so only on symbols TapeHawk records, and it reaches back 24 hours.
- A bracket appears after the peak it marks, once the line has fallen back — never at the moment the cluster is still firing.
- The totals are in the quote currency and depend on how busy the symbol is, so the line's height does not compare between symbols, and the band's scale fits the values on screen.
- It takes one of the panel's two band places — see Over the price, and in bands.