Trades
The executed trades drawn as bubbles over the heatmap — where they traded, how much, and how much of it was buying or selling.
Individual executed trades, drawn as dots over the heatmap.
- Heatmap
- any range
- Alerts
- no
What it shows
The trade bubbles of a heatmap: each bubble sits at the price and time trades happened, grows with how much traded, and is split into the share bought at the ask and the share sold at the bid. Every heatmap panel starts with them switched on.
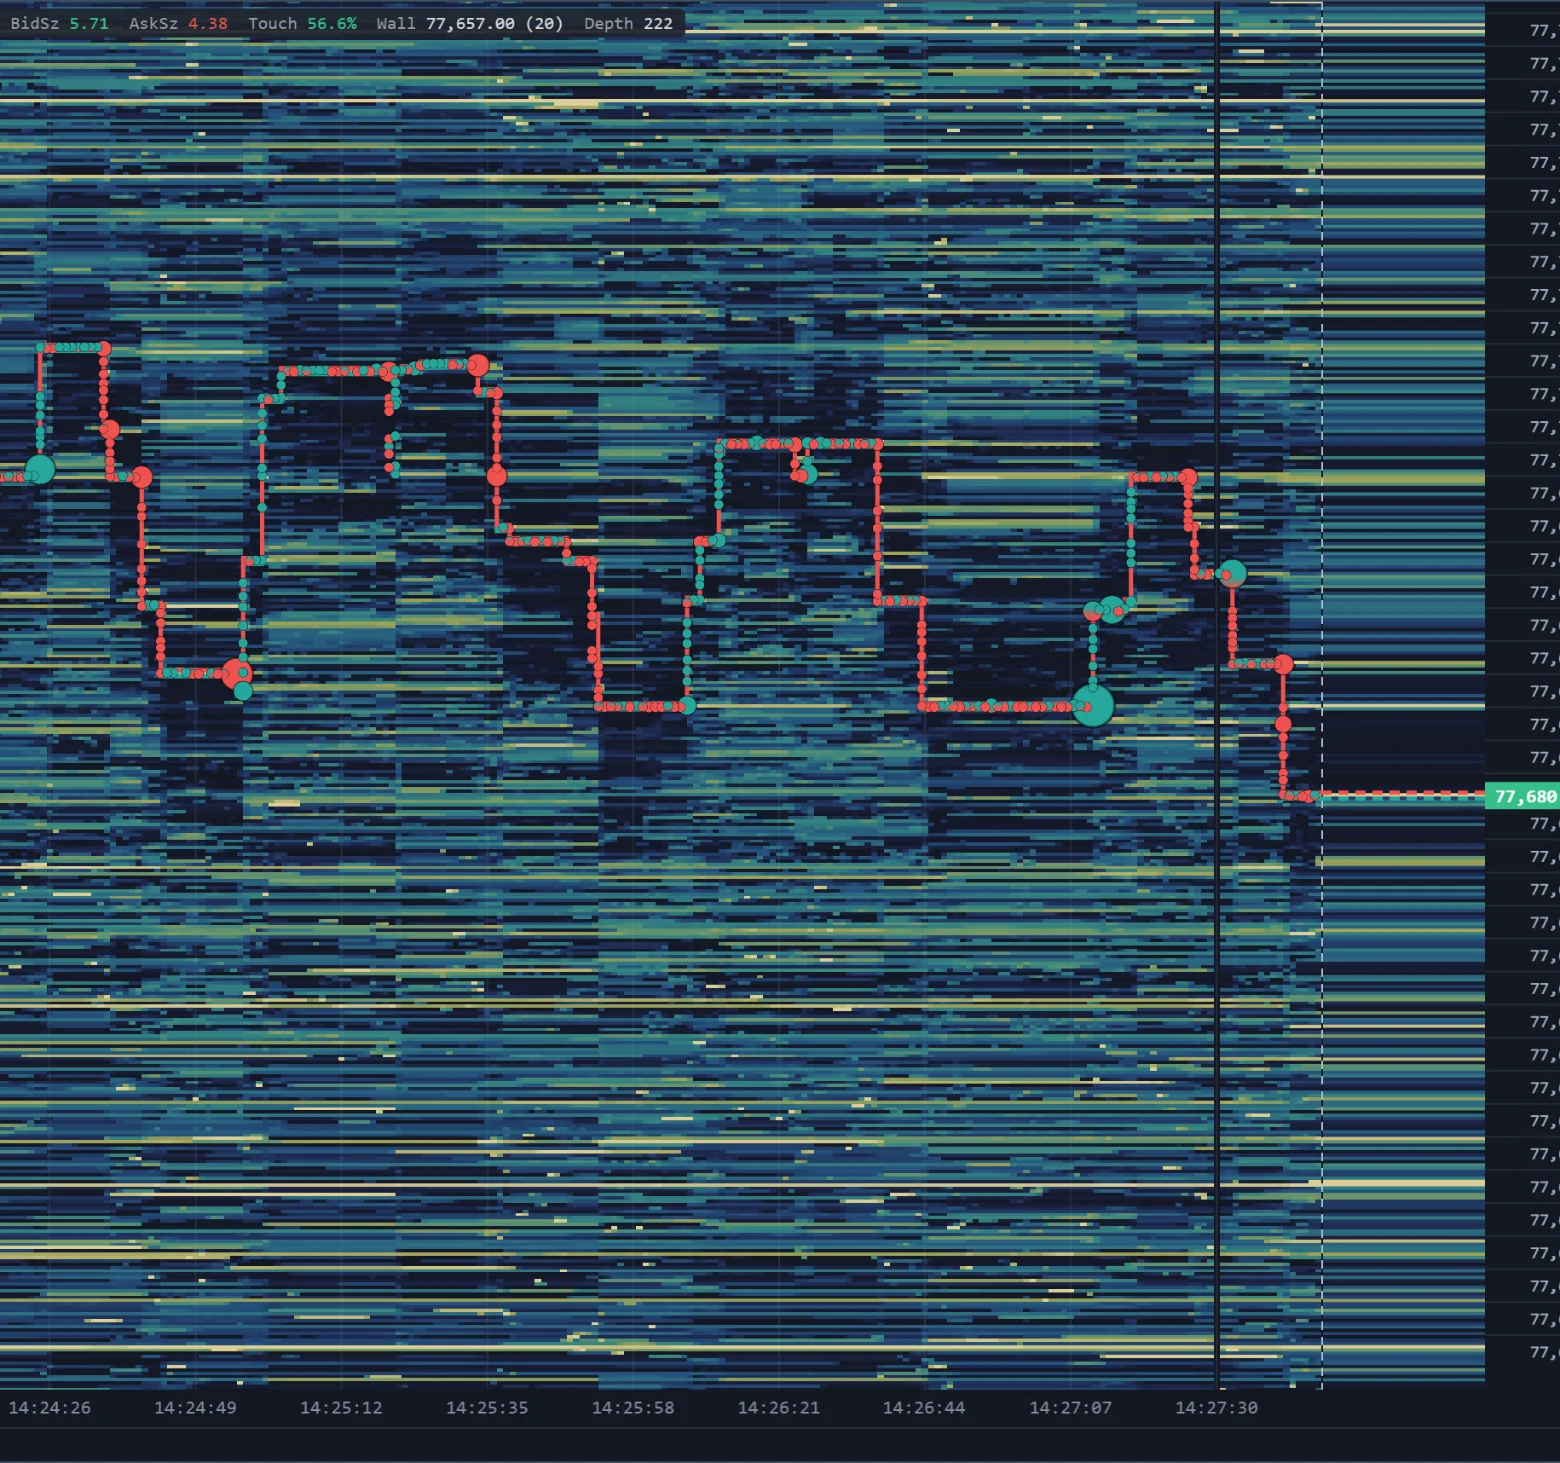
Trade bubbles covers them in full — what a bubble's size and colours mean, and how trades are grouped into bubbles.
How to read it
- Bubbles against the heat field tell traded liquidity from pulled liquidity: a band that fades where bubbles print was traded away; a band that vanishes with no bubbles was withdrawn.
- Large bubbles mark where size actually changed hands, and on which side the aggression was.
- Rows of bubbles at one price against a steady band describe resting size absorbing aggressive trading.
Parameters
This indicator has no settings.
The bubbles' settings are not in a settings dialog: the row has no gear. They are in Settings (⚙) with the heatmap panel selected — the minimum trade shown, the colours, how trades are grouped into bubbles, how a bubble is painted and its size. See Trade bubbles.
Limitations
- It exists only on heatmap panels, and a heatmap panel cannot remove it — only hide it, from the indicator menu or with the eye on its row in the info bar.
- It can be on a panel only once.
- On long ranges each column keeps only its largest bubbles, and a minimum trade setting hides the small ones, so a price can have traded without a bubble showing.
- It takes no alert.
Market Volume Imbalance
An arrow on the heatmap where aggressive volume tipped hard to one side — the V-Delta reading turned into events on the price.
Footprint
The footprint drawn over the heatmap — each bar a block of bid and ask volume by price, laid across the stretch of the heat field its trades printed in.