Footprint
The footprint drawn over the heatmap — each bar a block of bid and ask volume by price, laid across the stretch of the heat field its trades printed in.
The footprint laid over the heatmap: each bar becomes a block of bid | ask volume per price, spanning exactly the stretch of the heat field its trades printed in — so you read what traded against the liquidity that was resting there.
- Heatmap
- any range
- Alerts
- no
What it shows
Footprint bars drawn on top of a heatmap panel. Each bar becomes a block that spans exactly the part of the heat field its trades printed in: a 1-minute block covers that minute of resting liquidity, no more and no less. Inside the block, every price row shows the volume sold at the bid on the left and bought at the ask on the right, with a thin candle down the middle and the bar's volume and delta above it.
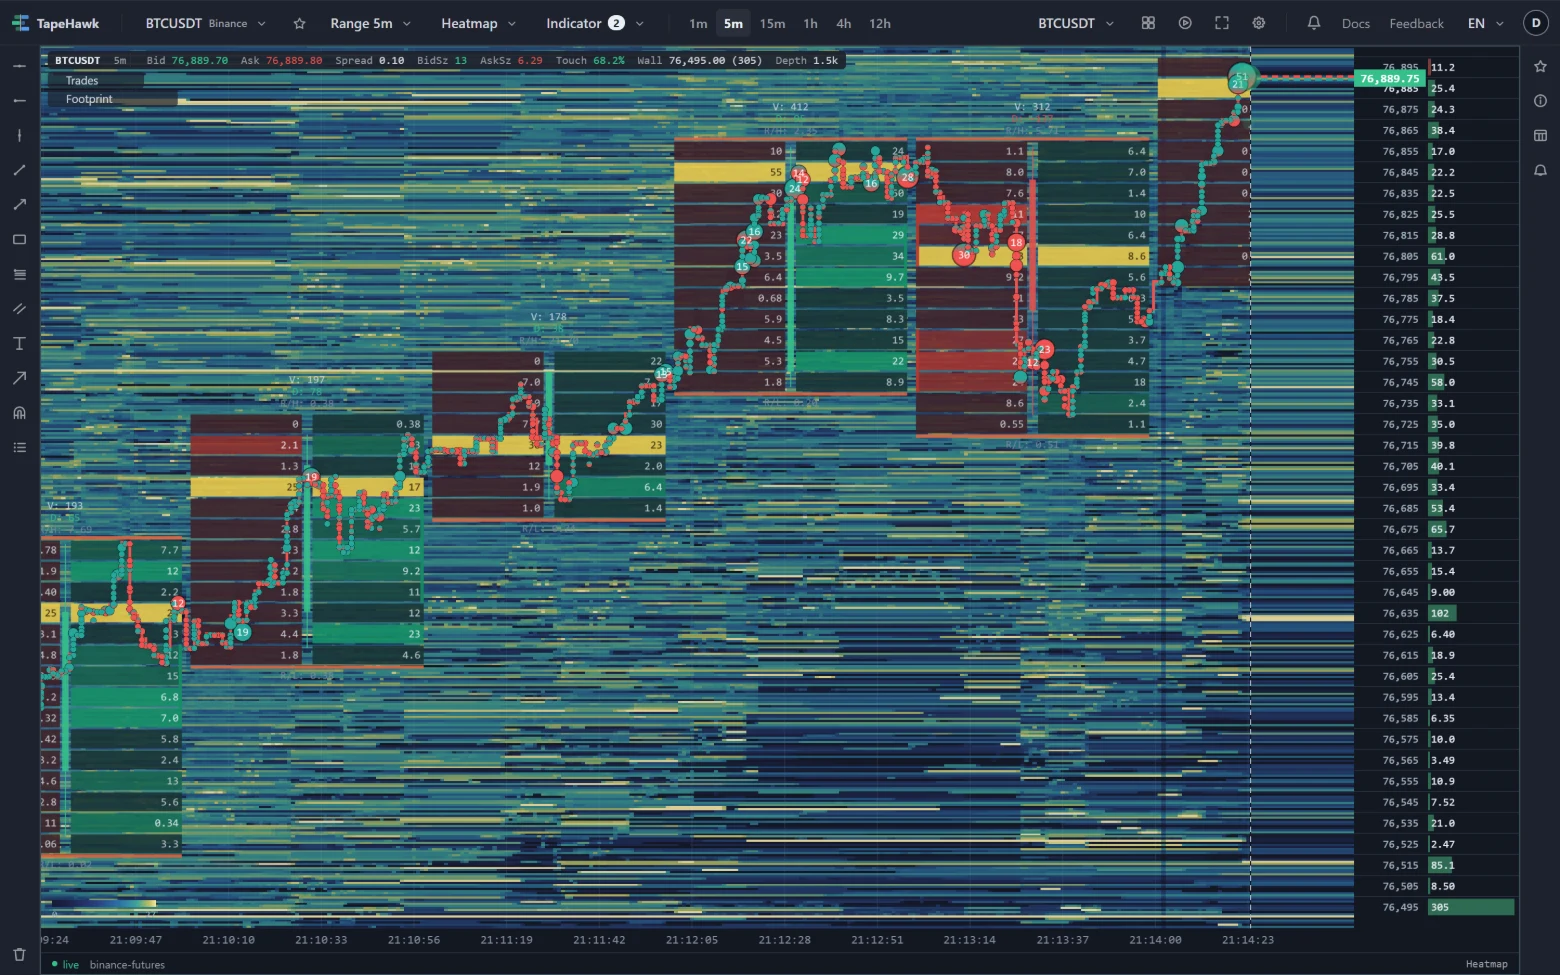
The heat field keeps its own fine time grid underneath, so a block is wide and the liquidity behind it still moves second by second. The block being formed is cut off at the live edge and grows as the minute runs.
The cells follow the same rules as the footprint chart: colours come from the diagonal imbalance, and the busiest row of each bar is its point of control.
How to read it
- Traded against resting. A row with heavy volume sitting on a bright band of liquidity is size being absorbed there; heavy volume where the heat had already thinned out is the market trading through an empty book.
- Which side hit the band. When price reaches a wall, the half of the row that is heavier tells you who was aggressive into it: sellers hitting the bid, or buyers lifting the offer.
- Bars that did not follow through. A block whose volume piled up at one edge while the band beyond it held says the aggression was met; the next block starting back inside the range confirms it.
Parameters
| Setting | Control | What it does |
|---|---|---|
| Bar width | Choice Auto (fits the zoom) · 1 minute · 5 minutes · 15 minutes · 1 hour | How long one block is. Auto takes the shortest bar that still fits bid and ask side by side at the current zoom, and moves as you zoom; a fixed width stays put and simply narrows when you zoom out. default: Auto (fits the zoom) |
| Cell content | Choice Bid | Ask · Delta · Total volume | What each price row prints: both sides, their difference, or their sum. default: Bid | Ask |
| Opacity (%) | Number | How solid the blocks are. Lower lets the heat field show through the cells. 30–100 · default 90 |
Bar width sets how long one block is. Auto (fits the zoom) picks the shortest bar that still fits bid and ask side by side at the current zoom — 1 minute on a 5-minute range, longer bars as the range widens — and changes as you zoom. A fixed length stays put, and its blocks simply narrow when you zoom out.
Cell content chooses what each row prints: both sides, their difference, or their sum. Opacity (%) sets how solid the blocks are; lower lets more of the heat field show through the cells.
Limitations
- It exists only on heatmap panels, and bars come in 1, 5, 15 minutes or 1 hour — the lengths order flow is stored at.
- On Auto (fits the zoom), a panel too narrow for even hour-long blocks to hold their figures draws none.
- It is hidden during a bar replay: its bars are the live order flow, and the field under them is a recorded one.
- The block being formed is built from the live stream. A bar the stream finished is replaced by the stored copy a few seconds after it closes, so its last figures can shift slightly then.
- A block's rows are grouped the way footprint rows are, not the way the heat field's rows are, so they do not line up one-to-one with the bands behind them.
- It takes no alert.