Cells and colours
What each footprint cell shows, the three cell shapes, the four colour schemes, and what a full-size cell is measured against.
Four settings decide how a footprint row looks. They are in Settings (⚙) with the footprint panel selected, and they belong to that panel.
Cell content
The figure printed in each row:
| Choice | The row shows |
|---|---|
| Bid | Ask | Two cells: volume sold on the bid on the left, volume bought on the ask on the right. The default. |
| Delta | One figure: buy volume minus sell volume at that price. |
| Delta % | The delta as a share of the row's volume, from −100% (all selling) to +100% (all buying). |
| Total volume | The row's total volume. |
| Bid only | Only the volume sold on the bid. |
| Ask only | Only the volume bought on the ask. |
| Trades (sell | buy) | How many trades printed at that price, sells then buys. It counts trade events on the tape, and a venue merges fills into one event, so the count can be lower than the venue's own trade count. Rows from before trades were counted stay blank. |
Every choice except the first draws one cell per row. Bid | Ask also falls back to one cell showing the total when the column is too narrow for two figures, and always on a phone.
Cell shape
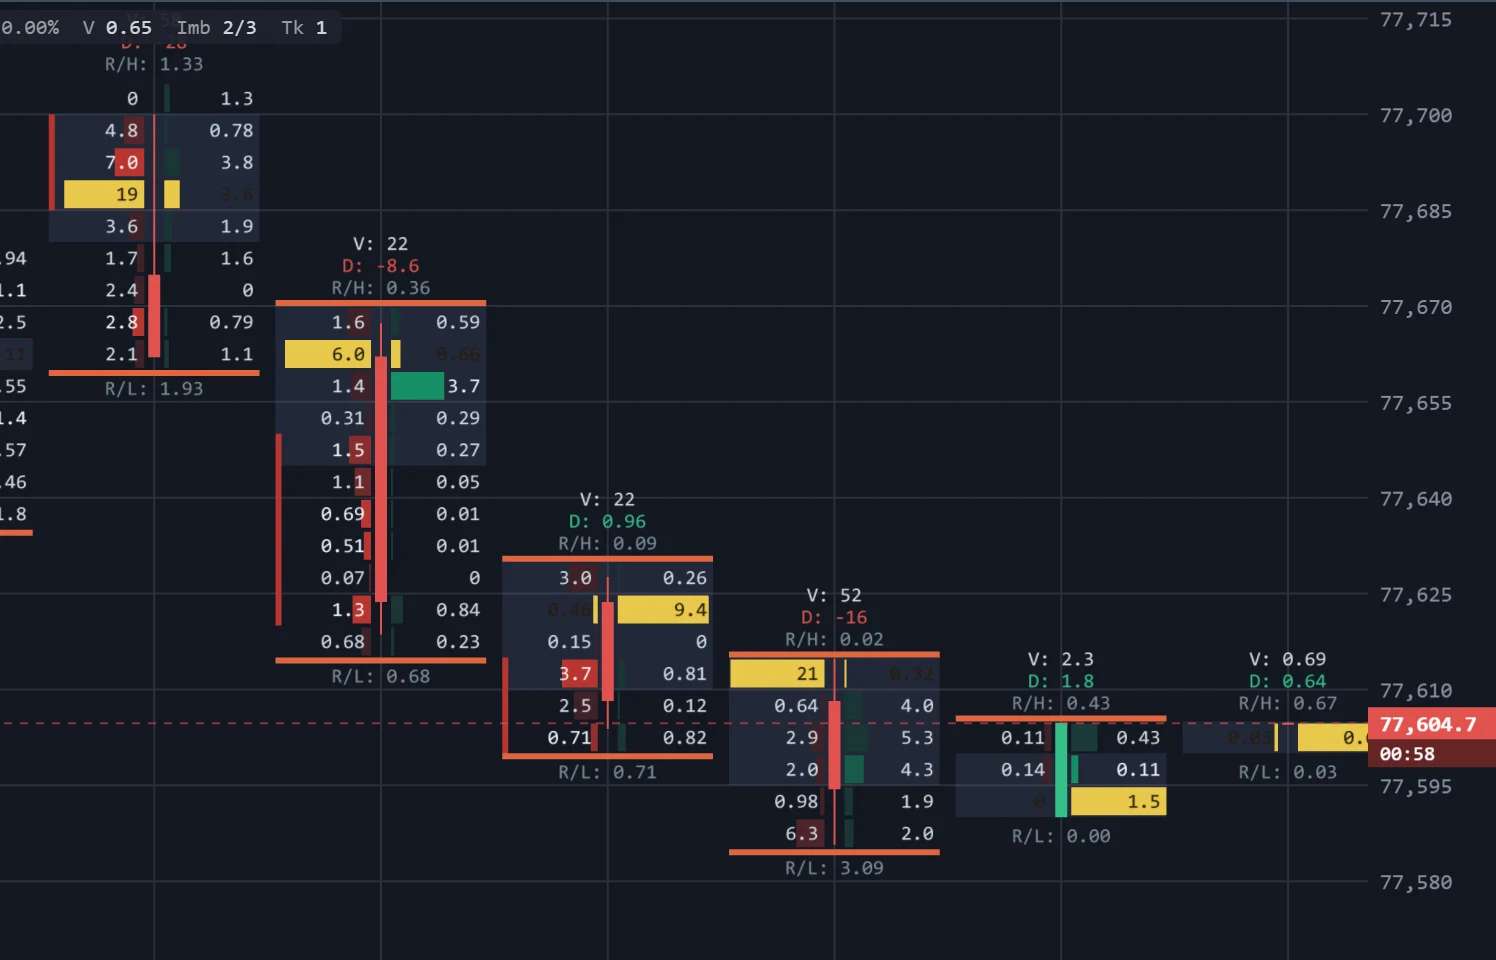
- Block — cells fill the column. The default.
- Histogram — each cell is a bar whose length shows the row's volume, so a bar reads as a volume profile.
- Brick — narrower blocks with space around them, so each row reads by its colour.
Colour by
| Scheme | Colour means |
|---|---|
| Imbalance | The side, and how strongly it won: bid cells red, ask cells green, more saturated the larger the imbalance. The default. See Stacked imbalances. |
| Side only | The side only, at one strength. |
| Volume heatmap | The row's volume — or each side's, with bid and ask cells — on a heat scale. Side is not shown. |
| Volume grayscale | The same, in greys. Side is not shown. |
In every scheme the POC row stands out — gold, or the lightest grey in Volume grayscale. The cells use their own red and green, deliberately darker than the candle colour presets, so the candle drawn over them stays readable. Figures switch to dark ink on light cells.
Measured against
Appears when the shape is Histogram or the scheme is one of the volume scales. It sets what a full-length bar, or the brightest colour, stands for:
- This bar's POC — each bar against its own largest row. Every bar uses its full range, so shapes are easy to compare but sizes between bars are not. The default.
- Widest bar on screen — every bar against the largest row among the bars on screen, so a quiet bar looks quiet next to a busy one. The scale changes as you scroll.
- Widest bar held — against the largest row in every bar the panel has loaded, so the scale holds still while you scroll — until older bars load.