Row grouping
How many price levels one footprint row covers — automatically by zoom, a fixed number of ticks, a price step, or a target number of rows per bar.
A footprint row can cover one price level or several. Grouping levels into fewer, taller rows makes a bar easier to read at a glance; one row per tick shows every level. The choice is Row grouping, in the Settings popover with the footprint panel selected.
Rows always cover a whole number of ticks — the instrument's smallest price step — so a grouped row still starts and ends on prices the venue can trade at, and no level is split between two rows.
The four modes
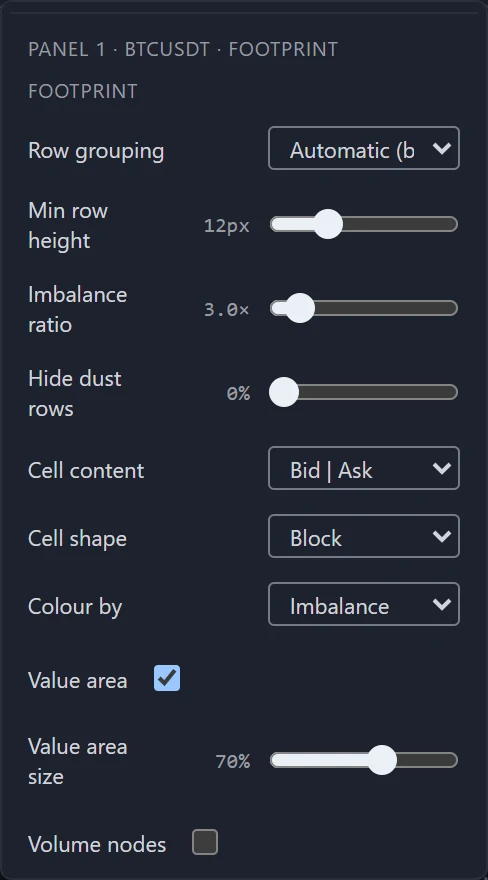
Automatic (by px)
The default. The chart picks the smallest grouping that keeps every row at least Min row height tall (12 px unless you change it), choosing among round steps — 1, 2, 5, 10, 25, 50 ticks and larger. Zoom in and rows split into finer levels; zoom out and they merge. Raise the minimum height for bigger, fewer rows.
Ticks per row
A fixed number of ticks per row, set in Ticks per row. The grouping holds as you zoom — see the one exception.
Price step
A fixed price distance per row, set in Price step. The value is rounded to a whole number of ticks, and the figure beside the box shows how many ticks that is — so on an instrument with a 0.1 tick, a step of 0.25 is shown as the 3 ticks it becomes.
Rows per bar
Aims for about Rows per bar rows across a typical bar on screen (the median height of the visible bars), using the same round steps as the automatic mode. Tall bars get more rows, and every bar uses the same grouping.
When rows merge anyway
Whatever the mode, a row is never drawn less than a pixel tall. If you squeeze the price axis so far that the chosen grouping would fall under a pixel, rows merge to the next round step until they fit; the status strip shows the step in force.
What the panel tells you
The status strip names the grouping in force whenever it has nothing more urgent to say, for example Automatic (by px) · step 5 — the mode and the price distance one row covers.
The tick comes from TapeHawk's data for the instrument when it has it. When it does not, the chart works it out from the gaps between the prices on screen, and the info bar marks it inferred tick. Hover that mark for the reason:
The tick is inferred from the prices currently on screen, not from the venue — the real merge step can change as you scroll.
Footprint overview
How a footprint panel opens each bar up by price — the bid and ask cells, the POC, the figures around each bar — and what changes as you zoom.
Cells and colours
What each footprint cell shows, the three cell shapes, the four colour schemes, and what a full-size cell is measured against.