Statistics grid
A table of per-bar figures under a footprint chart — the eleven rows you can show, how cells are shaded, and the layout settings.
The statistics grid puts the numbers you would otherwise read bar by bar into a table under the chart: one column per bar, one row per measure. Turn it on with Statistics grid in Settings (⚙) with the footprint panel selected. It is off by default.
Takes room from the price plot, like an indicator band.
The rows
Tick the rows you want. The grid shows them in this order, and at least one stays on.
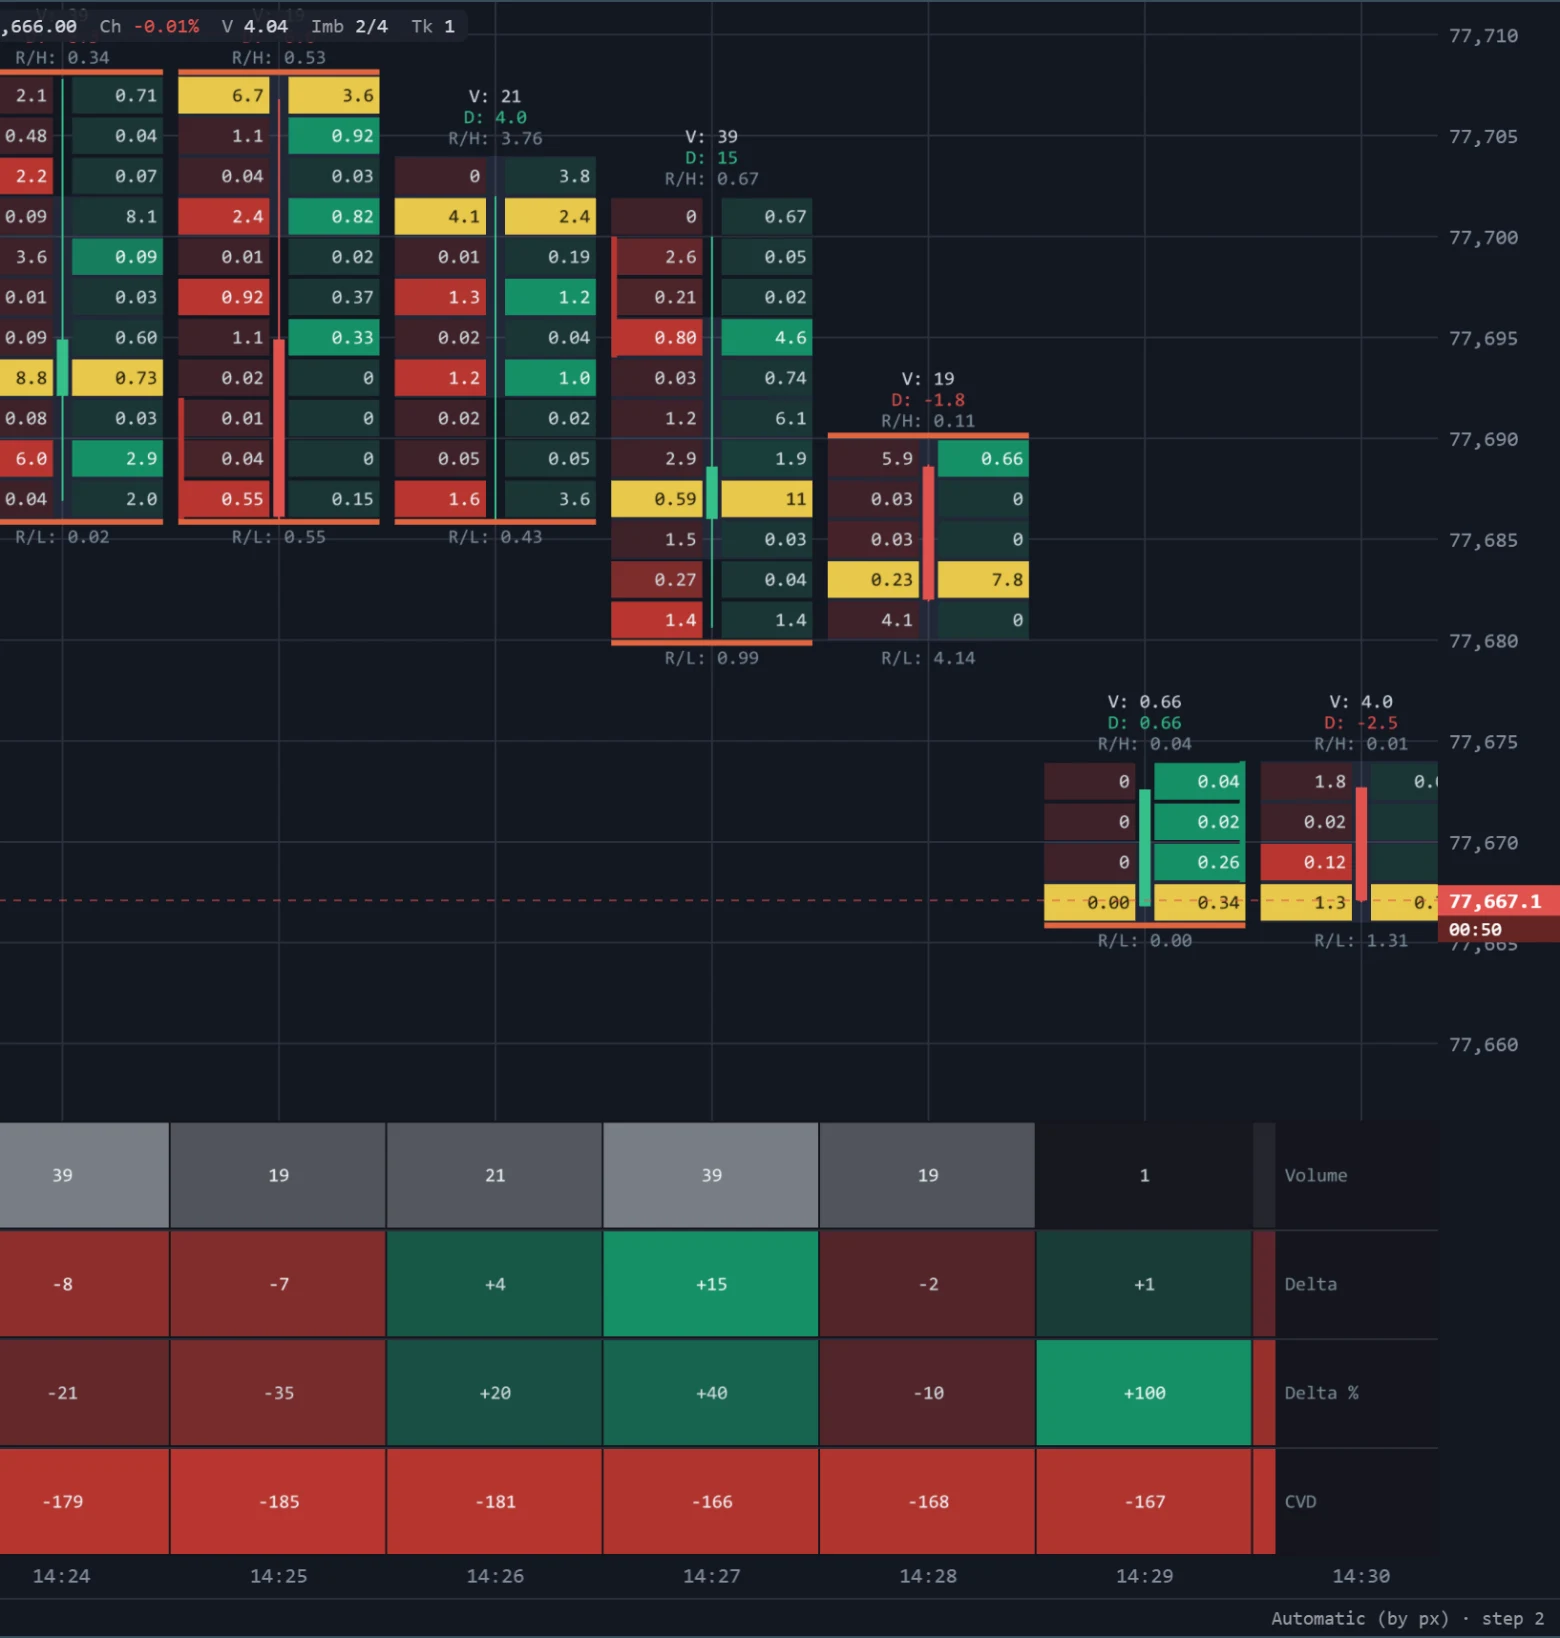
| Row | What it counts for each bar |
|---|---|
| Volume | Everything that traded |
| Buy volume | Volume where the buyer was the aggressor |
| Sell volume | Volume where the seller was the aggressor |
| Delta | Buy volume minus sell volume |
| Delta % | Delta as a percentage of the bar's volume |
| CVD | The running total of delta, as the CVD read-out shows it |
| Delta range | How far delta travelled inside the bar, from its lowest to its highest point — a bar can end flat after a big swing |
| Trades | The number of trades on the tape |
| Volume / s | Volume divided by the time the bar actually traded |
| Duration (s) | Seconds between the bar's first and last trade |
| Delta rate | Delta per active second, or per 1,000 trades — see below |
Volume, Delta, Delta % and CVD are on when you first turn the grid on.
The time-based rows measure from a bar's first trade to its last, not the full width of the timeframe — a 1m bar that traded for 20 seconds has a duration of 20. A bar whose trades all landed at the same instant has no per-second rate, and those cells stay blank. Cells for bars recorded before a measure existed are blank too, rather than showing a misleading zero.
Reading the grid
- Each row is shaded against the other bars on screen, so its strongest cell is the one that stands out in that row.
- Delta, delta % and CVD are coloured by sign; the other rows are shaded without a side.
- The trade count is always a whole number, whatever the decimals setting.
When Trades or Delta rate is on, the popover reminds you that trades are counted as tape events, which a venue may have merged from several fills.
Layout settings
| Setting | Choices |
|---|---|
| Row names | The names of the rows On the left (default), On the right or Hidden |
| Grid height | The grid's share of the panel height |
| Decimals | Decimal places for volumes and rates, 0 to 4 |
| Delta rate per | For the delta-rate row: Active second or 1000 trades |
| Show in thousands | Divides every figure by 1,000 |
If the grid is too short for every row you picked, rows are dropped from the bottom rather than squeezed; on columns too narrow for a figure, the shading stays and the numbers are left out.
Stacked imbalances
How footprint imbalances are measured diagonally, the imbalance ratio, stacked runs of imbalanced levels, and hiding dust rows.
Indicators
Adding, configuring, hiding and removing indicators, where each kind is drawn, the limits on one panel, and what the notes beside an indicator mean.