OBV
On-balance volume — a running total that adds each candle's volume on an up close and subtracts it on a down close.
Runs volume up or down with each candle's direction. Only the slope means anything, never the level.
- Candles
- 1m, 3m, 5m, 15m, 30m, 1h, 2h, 4h, 6h, 12h, 1d, 1w, 1M
- Footprint
- 1m, 5m, 15m, 1h
- Alerts
- no
What it shows
A line in a band under the price plot. Starting from zero at the oldest candle loaded, it adds a candle's whole volume when the candle closes higher than the one before, subtracts it when it closes lower, and leaves the total unchanged when the close is the same.
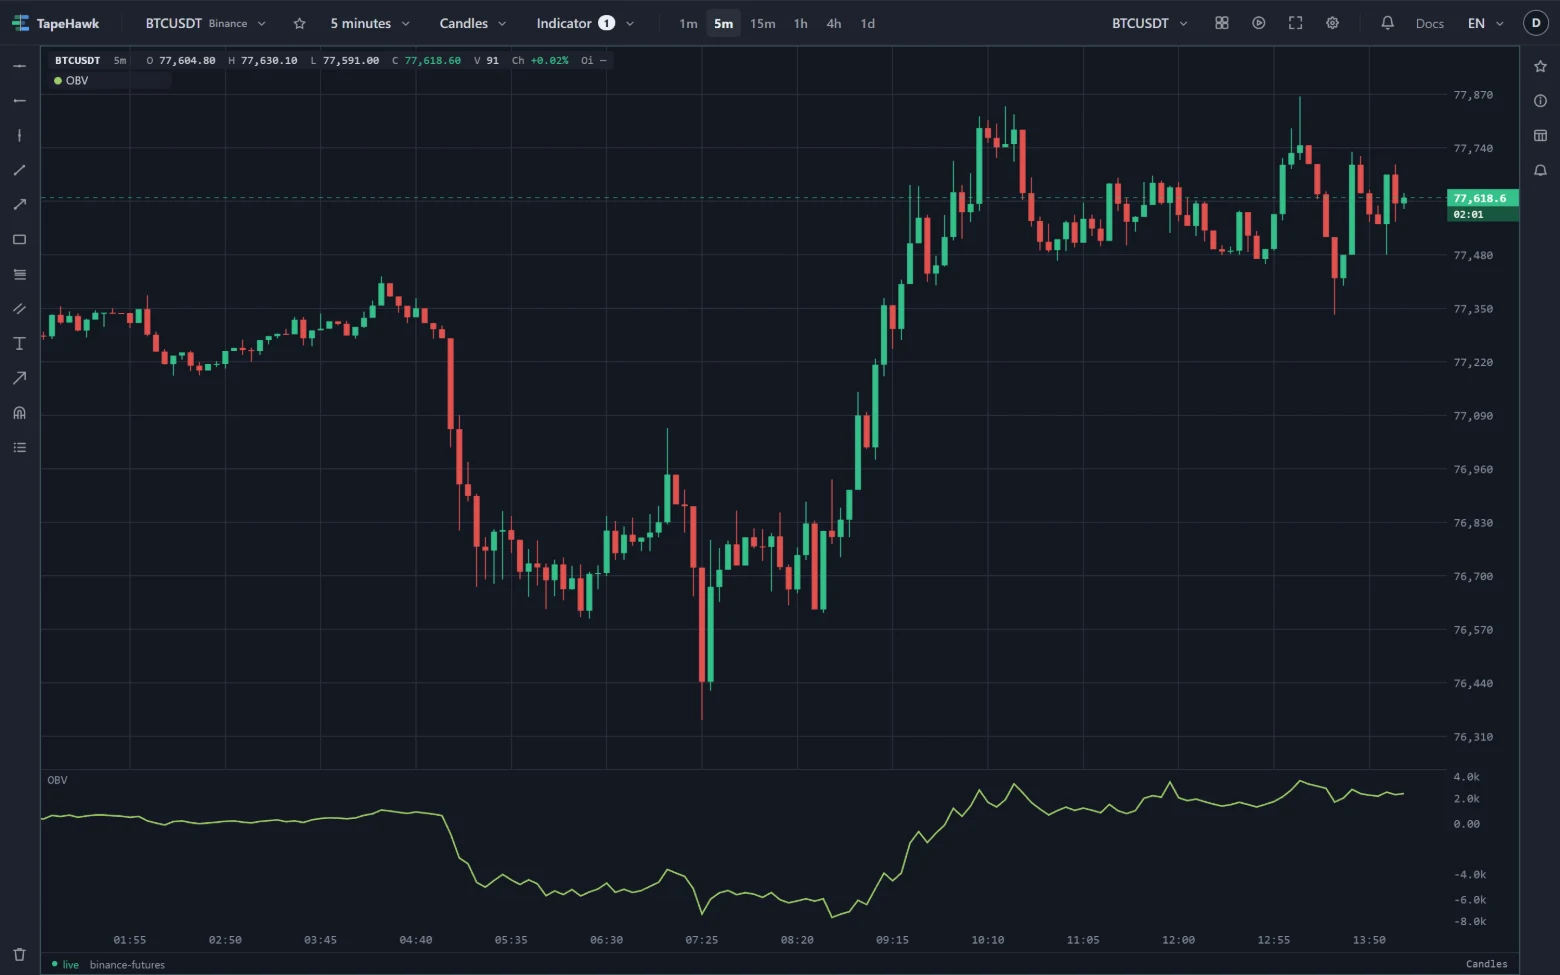
The running total rises while volume is concentrated on up closes and falls while it is concentrated on down closes. Its level on its own means nothing — only its direction does.
How to read it
- Slope. OBV rising with price says volume has been flowing into the up candles; falling with price, into the down candles.
- Divergence. Price rising while OBV flattens or falls suggests the rise is happening on lighter volume than the dips between it. The reverse at lows suggests selling is drying up.
- Breaks. OBV breaking out of its own recent range before price does is read by some traders as volume moving ahead of the price.
Parameters
| Setting | Control | What it does |
|---|---|---|
| Height (%) | Number | Height of the band, as a percentage of the panel. Dragging the band's edge changes it too. 8–50 · default 18 |
| Colour | Colour |
OBV has no length: every candle loaded counts. Height (%) is the band's share of the panel's height; dragging the band's top edge changes it too.
Limitations
- The level depends on where the loaded history begins. The total starts at zero on the oldest candle loaded, so when you scroll back and older candles load, the whole line moves up or down. Compare slopes and turns, not values.
- A candle counts all of its volume in one direction, however it traded inside. A candle that closes a fraction higher on heavy two-sided trading adds its full volume.
- The band's scale fits the values on screen, so the line's height in the band changes as you scroll or zoom.
- The newest candle is still trading: its volume, and whether it adds or subtracts, can change until it closes.
- It takes one of the panel's two band places — see Over the price, and in bands.
- It follows the candle shape: on Heikin Ashi it uses the real closes, and on Renko, range bars and line break the closes and volume of the bricks and bars drawn, where volume is an estimate or partial on two of the three — see Candle shapes.
- It takes no alert. Its Alert tab says it draws no signal.